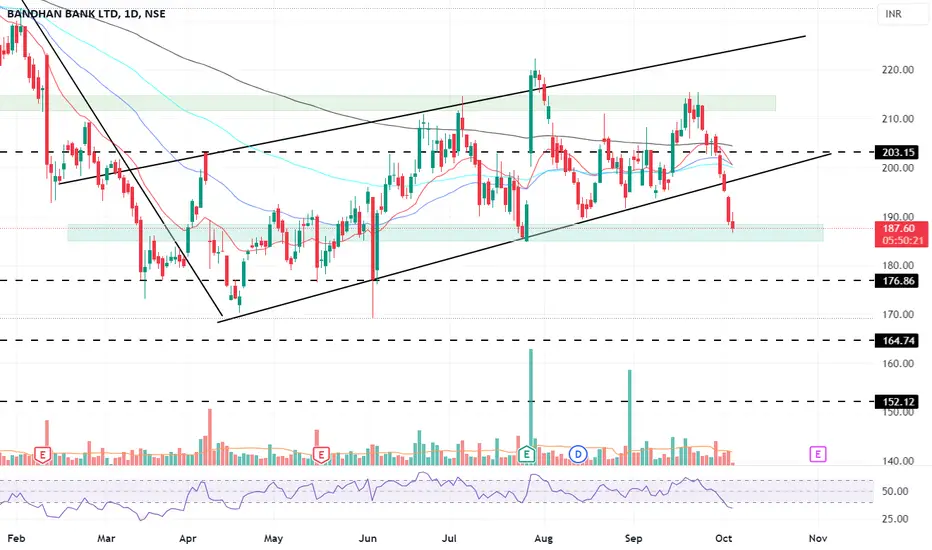
Banhan Bank Ltd. (NSE) - Quick Technical AnalysisCurrent Price: ₹186.85 (-1.14%)
Support Levels : ₹176.86, ₹164.74, ₹152.12
Resistance Levels: ₹203.15, ₹210-220
The stock recently broke below a rising channel , indicating a short-term bearish trend.
RSI near oversold (30-40) suggests a potential relief rally or consolidation near support.
Moving Averages: Trading below the 50-day MA, testing the 200-day MA.
Volume: Declining, signaling reduced selling pressure.
Conclusion: Watch for a rebound near ₹176. A recovery above ₹190 may restore bullish momentum, while a break below ₹176 could lead to further downside.
BANDHANBNK trade ideas
READY FOR BREAKOUT IN BANDHANBANK...NSE:BANDHANBNK trade at 206 level, Stock trade in a Triangle range since 5 Years, After breakout You can watch for a big upside movement.

Wedge Pattern breakout in BANDHANBNK for 225+ TargetsOn 1 Hour Timeframe, Wedge pattern formation occured in BANDHANBNK. It indicating breakout of resistance level near 208 level in this stock. After breakout can go long above 208 with small stop loss at 204 for target of 218 to 225 for upcoming few trading session. This setup will fail if BANDHANBNK starts trading below 204 level after breakout.

Bandhan Bank LtdImportant points marked.
*****Education purpose only*****
*****Investing in Equity is subjected to market risk do own research before investing*****

Bandhan Bank.............seems to be ready for upside NSE:BANDHANBNK
For now........CMP- 200/-
A larger complex correction seems to be ended here.
As I marked the wave a weekly close above 220(possibly otherwise above 260)should trigger the rally upside

Bandhan Bank Sell at 206 for the target of 200.58Bandhan Bank is seeing weakness at the upper levels, Bandhan Bank can be sold for the target of 200.58, the stock may see a decline of 2 to three percent in the short term.

Bandhan Bank LtdBandhan Bank is currently showing a potential reversal from a support zone around ₹193.18. The stock has seen a bounce after a prolonged downtrend, signaling possible buying interest at lower levels.
Key Levels:
Entry: ₹198.72 (current level)
Target: ₹209.56 (+5.34%)
Stop Loss: ₹193.18 (-2.56%)
Technical Outlook: The stock has formed a bullish candlestick pattern on the daily chart, confirming the support level at ₹193.18. The risk/reward ratio stands at 2.08, making this setup attractive for a short-term trade. Volume spikes suggest institutional buying at lower levels, adding confidence to the bullish outlook.
Strategy:
Buy Zone: Around ₹198.72
Target: ₹209.56
Stop Loss: Below ₹193.18
Risk/Reward Ratio: 2.08
Disclaimer: This analysis is for educational purposes only. Please do your own research or consult with a professional financial advisor before making any trading decisions.

Bandhan bank - At a crucial JunctureBandhan Bank has been trying hard to break 200 level.
Big movement around these levels in past consistently.
Fall has been without volumes and accumalation taking place
Risk Reward favorable. Can be looked int for higher levels as well on higher time frame with same SL
Disclaimer: Only for educational purpose.

3YRS of consolidationwill it give a big move if it break out happens? i am expecting a 100% move if the breakout happens ,the difficult part is identifying the real breakout when happening, already two upward move above the trendline failed and i think we can trust the third move above the trend line and enter

Long Term Bet - Bandhan Bank LtdBandhan Bank was once everyones portfolio favourites and have been a patience tester for its investors.
Currently stock price is trading at multiyear support zone and have formed falling wedge pattern around its support, gives good Risk to Reward Ratio.
Company is trading at PE of 12.6 which is slightly above industry PE of 12.
Company has declared good results as compared to previous quarter.
Although big concern from previous quarter result is that company's NPA and GNPA have increased which is red flag, but other factors have shown good growth.
Stock Price CAGR of last 5 years is -16% where as compounded sales growth has been 23%, also profit growth is low but still positive for last 5 years. This may be soon show value unlocking.
Company has good FII holding of around 27% which has decreased from last quarter but positive side is DIIs have increased the stake in the company from last quarter.
FIIs have been continuous sellers in overall market but this has not impacted our market, we have been reaching new highs due to good domestic institutions and retail buying power. Hoping same case would be in this stock as well.
This Stock may show good upside but can test our patience but it should be in our portfolios at this level.
Major resistance have been marked in the chart itself. Personally I am looking at this stock as investment once the breakout is done. May touch 400 till end of next year.
Please do your analysis based on your risk management and patience level before taking any trade.
Happy Investing..

BANDHAN BANK LTD S/R Support and Resistance Levels:
Support Levels: These are price points (green line/share) where a downward trend may be halted due to a concentration of buying interest. Imagine them as a safety net where buyers step in, preventing further decline.
Resistance Levels: Conversely, resistance levels (red line/shade) are where upward trends might stall due to increased selling interest. They act like a ceiling where sellers come in to push prices down.
Breakouts:
Bullish Breakout: When the price moves above resistance, it often indicates strong buying interest and the potential for a continued uptrend. Traders may view this as a signal to buy or hold.
Bearish Breakout: When the price falls below support, it can signal strong selling interest and the potential for a continued downtrend. Traders might see this as a cue to sell or avoid buying.
20 EMA (Exponential Moving Average):
Above 20 EMA: If the stock price is above the 20 EMA, it suggests a potential uptrend or bullish momentum.
Below 20 EMA: If the stock price is below the 20 EMA, it indicates a potential downtrend or bearish momentum.
Disclaimer:
I am not a SEBI registered. The information provided here is for learning purposes only and should not be interpreted as financial advice. Consider the broader market context and consult with a qualified financial advisor before making investment decisions.

Bandhan bank ready for breakout.Bandhan bank ready for monthly breakout .Focus this stock and add your watchlist.
buy---current price
SL---168
TGT ----400
ONLY FOR LONG HOLD PEOPLE

BANDHAN BANK LTD S/R Support and Resistance Levels: In technical analysis, support and resistance levels are significant price levels where buying or selling interest tends to be strong. They are identified based on previous price levels where the price has shown a tendency to reverse or find support.
Support levels are represented by the green line and green shade, indicating areas where buying interest may emerge to prevent further price decline.
Resistance levels are represented by the red line and red shade, indicating areas where selling pressure may arise to prevent further price increases. Traders often consider these levels as potential buying or selling opportunities.
Breakouts: Breakouts occur when the price convincingly moves above a resistance level (red shade) or below a support level (green shade). A bullish breakout above resistance suggests the potential for further price increases, while a bearish breakout below support suggests the potential for further price declines. Traders pay attention to these breakout signals as they may indicate the start of a new trend or significant price movement.
20 EMA: The yellow line denotes 20 EMA, to interpret the 20 EMA, you need to compare it with the prevailing stock price. If the stock price is below the 20 EMA, it signals a possible downtrend. But if the stock price is above the 20 EMA, it signals a possible uptrend.
Disclosure: I am not SEBI registered. The information provided here is for learning purposes only and should not be interpreted as financial advice. It is important to consult with a qualified financial advisor before making any investment decisions. Tweets neither advice nor endorsement.

bandhan future multibagger bandhan bank for daredevils..?????...on verge of bottom out......best long term accumulatn....or sip

$bandhanbank- buy the blood buy the blood and forget about it till it reclaims the white line or 250ish
patience this is only a shaking out and final capitualation or trasnfer of wealth imo
got some , let it form a range here for a few days and we resume up only target is white line above
time frame give it a few years
invalidation if no reaction next few days

Bandhan Bank idea | Key LevelsBandhan Bank idea | Key Levels
168/- imp support levels - below this we can see 156/148

Bandhan Bank - Magic waiting to happenThe chart is self-explanatory as always :)
⚠️Disclaimer: We are not registered advisors. The views expressed here are merely personal opinions. Irrespective of the language used, Nothing mentioned here should be considered as advice or recommendation. Please consult with your financial advisors before making any investment decisions. Like everybody else, we too can be wrong at times ✌🏻

bandhan bank target and buying zonebandhan bank looks good to buy.
different target are set and buying zone are giving in the chart

bandhan bank.bandhan bank is in now littel sell zone... once cross 2430 to 256 we can expect a good move upto 289

Bandhan bank - Ready to breakout of its bandhan (Hindi)Watch the trendline resistance.. if it breaks that, there can be a good upmove.

Bandhan Bank coming to a great place after 4 years...Bandhan Bank is coming back to the strong buying zone for an amazing risk reward..

Bandhan BankBandhan Bank CMP 208
Looking at the structure ,
it looks like Bandhan Bank has completed its WXYXZ correction
and ready to start its upmove...
Also believe wave 1 of the upmove is completed...
which is also indicated by positive crossover by indicator....
a Dip till 183-193 ...
for a stop of 175 ...
I am expecting it for 440/625+ in the next leg of upmove...
Just a View!!
Vedang!
:)

Bandhan Bank LtdBandhan Bank chart has made tripple Bottom Pattern and it is now expected to move in upward direction.
(Educational purpose only)
#ChartCharitra
