BAYER CROPSCIENCE - Potential 40% upmove Mid Term IdeaThe stock is in strong uptrend.
Moving out of a 4 year old consolidation zone.
Coming out of a 5 week old
consolidation, Daily VCP Breakout.
Ready for Swing Targets
15% 8215, then 9579 - Short To MId Term Targets 3-6 months.
SL 5% 6576 Daily closing Basis.
BAYERCROP trade ideas

$bayercropsciencelooking for a sweep of white line then up
on watch list for monday
expecting range low for weekly on monday for the nifty then we run it back

BAYERCROP LONGThis stock fundamentally too strong also its agri product
it will go upto 8-9k 6month-1year
if its retrace 5k-4k-3k is entry
no stoploss only for investment
dividend is Rs.100+/year

SWING IDEA - BAYER CROPSCIENCEBayer CropScience , a global leader in agricultural science, is exhibiting technical indicators that suggest a promising swing trading opportunity.
Reasons are listed below :
6500 Resistance Breakout : The 6500 level has been a significant resistance zone. The price is now breaking out above this level, indicating strong bullish momentum.
Breaking 4+ Year Consolidation Phase : The stock is breaking out of a long consolidation phase that lasted over 4 years, signaling a potential new bullish trend.
Strong Bullish Marubozu Candle on Weekly Timeframe : The recent formation of a bullish marubozu candle on the weekly chart indicates strong buying pressure and suggests potential for further upward movement.
Bounced Back from Golden Fibonacci Zone : The stock has bounced back from the golden Fibonacci retracement level (0.618), a key area where prices often rebound, indicating potential for an upward move.
Trading Above 50 and 200 EMA on Weekly Timeframe : The stock is trading above both the 50-week and 200-week exponential moving averages (EMA), reinforcing the bullish sentiment and providing strong support levels.
Trading at All-Time High : The stock is trading at its all-time high, suggesting strong market confidence and potential for further gains.
Target - 7670 // 8700
Stoploss - weekly close below 5600
DISCLAIMER -
Decisions to buy, sell, hold or trade in securities, commodities and other investments involve risk and are best made based on the advice of qualified financial professionals. Any trading in securities or other investments involves a risk of substantial losses. The practice of "Day Trading" involves particularly high risks and can cause you to lose substantial sums of money. Before undertaking any trading program, you should consult a qualified financial professional. Please consider carefully whether such trading is suitable for you in light of your financial condition and ability to bear financial risks. Under no circumstances shall we be liable for any loss or damage you or anyone else incurs as a result of any trading or investment activity that you or anyone else engages in based on any information or material you receive through TradingView or our services.
@visionary.growth.insights

Bayer Crop.All time high breakout. With decent volume accumulation. The stock is above 100-200 ema showing an uptrend. Along with this in Budget of 2024; nirmala sitaranam is allocating funds to agriculture.

Bayer crop science seems great Breakout Target of 8250### Swing Trading Alert: Bayer CropScience (CMP 6513.25) - Target 8250.65, SL 6000
#### Trade Setup:
- **Current Price (CMP):** 6513.25
- **Entry Point:** Confirm entry upon a successful breakout above 6600.
- **Target:** 8250.65
- **Stop Loss:** Below 6000
#### Analysis:
Bayer CropScience Ltd is showing signs of a bullish breakout, indicating a potential upward movement towards the target of 8250.65. Managing risk with a stop loss below 6000 is recommended.
#### Disclaimer:
This trading alert is for informational purposes only and does not constitute financial advice. Trading stocks involves significant risk and may not be suitable for all investors. It is essential to conduct your own research and consult with a financial advisor before making any trading decisions. Only trade with capital that you can afford to lose, and ensure you understand the risks associated with stock trading. The author is not responsible for any losses incurred from following this recommendation.

BAYERCROP - ANOTHER LEG OF RALLY?A strong bullish engulfing candle in the weekly time frame suggesting that this stock is nicely poised to re-test the previous high of 6000 again...
If the stock closes above its previous high of 6200 on weekly basis, it might test the 1.27 and 1.414 fibo extension levels...

bayer cropscience 1w time frame channel breakout buy @ 5305 bayer cropscience 1w time frame
channel breakout buy @ 5305
target @ 5822, 5999, 6082
risk reward 1:5
its just a view trade @ your own risk
sl@4769

Short swing risky tradefind the pattern hidden. I am not going to personally entertain this trade as I am bullish with it sector but if you think you have a similar analysis show up.

bayer corp trend line break outgiven good trend line break out
resistance shown as per trend lines.
RSI above 60 daily , monthly, weekly

Bayer crop science # breakout and retesting stock Results are good.. stock witnessed a good breakout with volume... sound fundamentals... now above the support.. can buy for good returns in one year+ horizon

Bayer Crop SciencesLooking good as the Monthly MACD crossover is also being happened with huge volumes
Monthly 20 over 50 crossover is about to happen
Monthly candle BO the important gann levels at 4648( stop less should be below this level based on your risk appetite)

BAYERCROP ..... chemical sector NSE:BAYERCROP
focus on CHEMICAL SECTOR,
Bayercrop is in STAGE 2, continuous breakout.
Trade at your own risk,
educational purpose only.

BAYERCROP - Demand re-emerged near 4500 in Nov'22Has been range bound in 4200-5700 for 2 yrs
Plan ahead => could consider to Buy above 5500
and/ or Rejections near 4200
PB 8x
PE 30x
ROCE 32%
DivYld 3%

Bayercorp in symetrical triangle chart makingAs you offen seen this chart formation in many ways. Its called symetrical triangle chart pattern in this chart when price broke it goes too far. As one can add it to watching and wait for breakout . Aggressive one can add it at 4537 price with SL 4300 and target 4800,5097,
5300. As you all know patience is the key of success. So be patience and wait

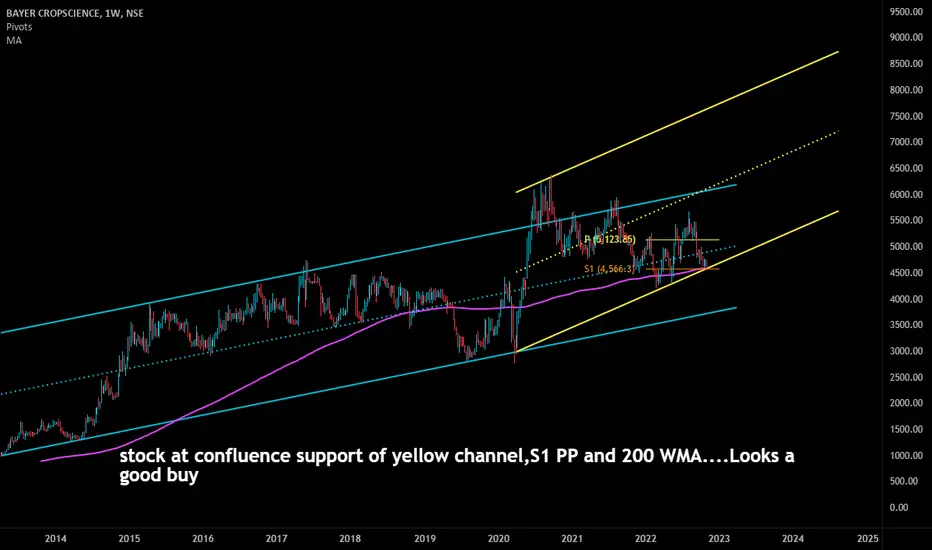
BAYERCROP is a good buy!stock at confluence support of yellow channel,S1 PP and 200 WMA....Looks a good buy
Reversing from triangle pattern support line keep in watchlist and analysis the stock, already price moved up from this support line

NIFTY This week and NextPlease note...200 DMA of 17000 above this we are in BULLISH ZONE..(Not bearish zone ..sorry for verbal typo )


Bayer Cropscience (Long)Good potential to move up
Now trading above 200 EMA on daily chart
Took support near 4500
Consolidated between 4650-4780 before moving up
Now again Consolidating between 4970 to 5180
Moving in upside channel
Buy near 5000 - 5050
SL 4900
TGT 5420 - 5593 - 5748 - 5998 - 6358
Please do correlate by yourself also on charts. This is for paper trading and educational purpose only. Must consult your Financial advisor before investing.

Bayer Crop science - Looks goodThe stock had created good short-term support on the daily chart.
Though it has strong resistance around 5000 levels, so it might move in a range for while.
Above 5000, it can move fast towards 5200-5300 levels.

Bayer Crop Science Target Price 5157.00BAYERCROP Stock. EMA 10, EMA 20, and Trend Line have a positive slope. And a bullish pin bar formed.

