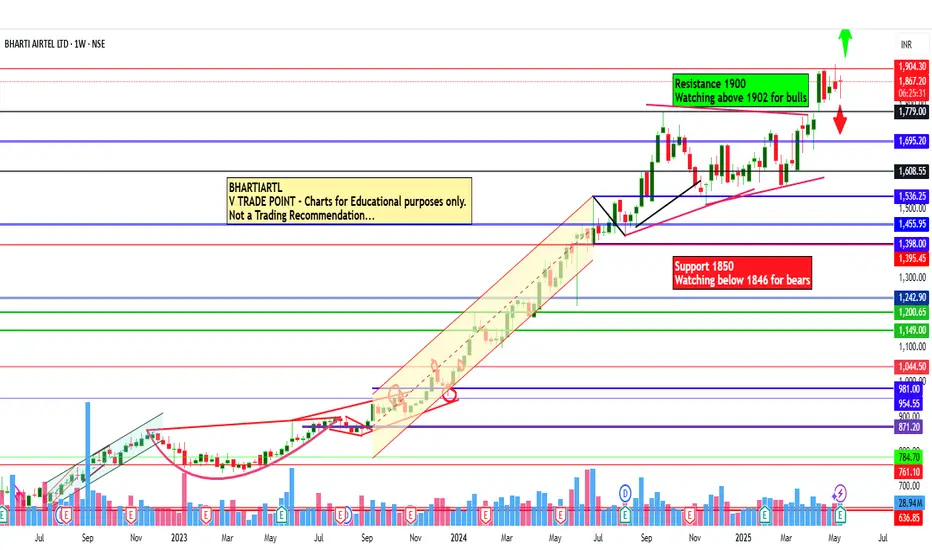
BHARTIARTL : Took a position for 1% riskEntered the position on a breakout above the all-time high, confirmed by a strong momentum candle and no immediate signs of retracement. The risk is of 1%.
📢📢📢
If my perspective changes or if I gather additional fundamental data that influences my views, I will provide updates accordingly.
Thank you for following along with this journey, and I remain committed to sharing insights and updates as my trading strategy evolves. As always, please feel free to reach out with any questions or comments.
Other posts related to this particular position and scrip, if any, will be attached underneath. Do check those out too.
Disclaimer : The analysis shared here is for informational purposes only and should not be considered as financial advice. Trading in all markets carries inherent risks, and past performance is not indicative of future results. It’s essential to conduct your own research and assess your risk tolerance before making any investment decisions. The views expressed in this analysis are solely mine. It’s important to note that I am not a SEBI registered analyst, so the analysis provided does not constitute formal investment advice under SEBI regulations.
BHARTIARTL trade ideas

BHARTI AIRTEL BECOMES READY TO BLASTBHARTI AIRTEL Will blast at any time so watch it for the short target of 1917, lets see what happens

Bharati Airtel Ltd view for Intraday 23rd May #BHARTIARTL Bharati Airtel Ltd view for Intraday 23rd May #BHARTIARTL
Resistance 1850 Watching above 1853 for upside momentum.
Support area 1800 Below 1830 ignoring upside momentum for intraday
Watching below 1797 for downside movement...
Above 1820-1822 ignoring downside move for intraday
Charts for Educational purposes only.
Please follow strict stop loss and risk reward if you follow the level.
Thanks,
V Trade Point

AIRTEL📈 Final Trade Plan – AIRTEL
Component Value
Trade Direction BUY
Entry Price 1726
Stop Loss (SL) 1711
Risk ₹15
Target Price 1995
Reward ₹269
Risk-Reward Ratio 17.9 🔥
Last Swing High 1780
Last Swing Low 1511
Strengths:
✅ All timeframes UP, with HTF zones acting as a base.
✅ Entry is right on the ITF proximal, backed by solid higher timeframe support.
✅ Tight SL (₹15) with large upside (₹269) → R:R of 17.9 is rare and powerful.
✅ Price is consolidating near the base, increasing breakout probability.
⚠️ Risks & Considerations
🔻 Entry is very close to SL. Use a candle close-based SL, not just a price wick.
⏱️ Expect sideways movement before breakout, so patience is key.
🔁 Revisit trade if 1711 breaks with volume—it could enter a deeper correction phase.
🧭 Tactical Suggestions
🟩 Ideal Entry Zone: 1726–1715
🟨 Wait for Price Action Confirmation: Bullish engulfing or strong volume above 1730.
🎯 Profit Booking Plan:
1st Target: 1780 (last high)
2nd Target: 1900
Final Target: 1995 (based on your projection)
📊 AIRTEL – Multi-Timeframe Demand Zone Analysis
🔷 Higher Timeframe (HTF)
Timeframe Trend Demand Logic Type Proximal Distal Avg Zone
Yearly UP Yearly Demand Rally–Rally 1780 1560 1670
Half-Yearly UP 6M Demand BUFL 1780 1408 1594
Quarterly UP Qtrly Demand BUFL 1742 1511 1627
HTF Avg 1767 1493 1630
🧠 Insight: Strong long-term demand base from 1400s to 1780. Repeated BUFL logic indicates consolidation before continuation. Historical supports intact.
🔷 Medium Timeframe (MTF)
Timeframe Trend Demand Logic Type Proximal Distal Avg Zone
Monthly UP Monthly Demand BUFL 1765 1669 1717
Weekly UP Weekly Demand BUFL 1765 1669 1717
Daily UP Daily Demand Support 1780 1742 1761
MTF Avg 1770 1693 1732
🧠 Insight: Current price action is inside a clean demand compression band. Demand has been tested, but structure is still bullish. Narrow buffer zone suggests a bounce likely with low drawdown.
🔷 Intraday Timeframe (ITF)
Timeframe Trend Demand Logic Type Proximal Distal Avg Zone
240M UP 240M Demand BUFL 1726 1711 1719
180M UP 180M Demand BUFL 1726 1711 1719
60M UP 60M Demand BUFL 1726 1711 1719
ITF Avg 1726 1711 1719
🧠 Insight: Entry at 1726 sits right at the proximal edge of ITF zone—this is an excellent sniper entry if confirmed with intraday price action (hammer/engulfing candles).

Bharati Airtel Ltd view for Intraday 16th May #BHARTIARTL Bharati Airtel Ltd view for Intraday 16th May #BHARTIARTL
Resistance 1900 Watching above 1902 for upside momentum.
Support area 1850 Below 1870 ignoring upside momentum for intraday
Watching below 1846 for downside movement...
Above 1870 ignoring downside move for intraday
Charts for Educational purposes only.
Please follow strict stop loss and risk reward if you follow the level.
Thanks,
V Trade Point
Bharti Airtel Ltd view for Intraday 8th May #BHARTIARTL Bharti Airtel Ltd view for Intraday 8th May #BHARTIARTL
Resistance 1900-1910 Watching above 1912 for upside movement...
Support area 1870 Below 1890 ignoring upside momentum for intraday
Watching below 1865 for downside movement...
Above 1890 ignoring downside move for intraday
Charts for Educational purposes only.
Please follow strict stop loss and risk reward if you follow the level.
Thanks,
V Trade Point

Bharati Airtel Ltd view for Intraday 6th May #BHARTIARTLBharati Airtel Ltd view for Intraday 6th May #BHARTIARTL
Resistance 1880 Watching above 1883 for upside movement...
Support area 1840 Below 1860 ignoring upside momentum for intraday
Watching below 1836 for downside movement...
Above 1850 ignoring downside move for intraday
Charts for Educational purposes only.
Please follow strict stop loss and risk reward if you follow the level.
Thanks,
V Trade Point

Bharati Airtel Ltd view for Intraday 6th May #BHARTIARTL Bharati Airtel Ltd view for Intraday 6th May #BHARTIARTL
Resistance 1880 Watching above 1883 for upside movement...
Support area 1840 Below 1860 ignoring upside momentum for intraday
Watching below 1836 for downside movement...
Above 1850 ignoring downside move for intraday
Charts for Educational purposes only.
Please follow strict stop loss and risk reward if you follow the level.
Thanks,
V Trade Point

Bharati Airtel Ltd view for Intraday 5th May #BHARTIARTL Bharati Airtel Ltd view for Intraday 5th May #BHARTIARTL
Resistance 1880 Watching above 1883 for upside movement...
Support area 1840 Below 1860 ignoring upside momentum for intraday
Watching below 1836 for downside movement...
Above 1850 ignoring downside move for intraday
Charts for Educational purposes only.
Please follow strict stop loss and risk reward if you follow the level.
Thanks,
V Trade Point


Bharti AIRTELBHARTI AIRTEL is in strong uptrend , but its good to buy around 1500 to 1545 after reversal confirmation and hold it for 1900

Will BhartiAirtel laugh continue .. Lets wait and see BhartiAirtel 1899 is on the verge of the rounding bottom neckline. If breaks out we shall find another 400 points rally. Support is at 1710.


$NSE:BHARTIARTL.1D SHORTNSE:BHARTIARTL
Recently the price action seems to be dead. Traces of distribution can be seen.
Short when crosses the previous low


BHARTI AIRTEL give Shorting Opportunityif BHARTI AIRTEL create today candle is Hanging Man so we have a create shoring trade. add in your watchlist.

#BhartiArtl Spot Sell Setup🔽#BHARTIARTL Spot Sell Setup
Last Close :1676.75 , Sell On Rise around 1718 For The Target 1462—-1286
Setup Will Fail If Breaks 1783 And Gives 2 Consecutive Candles Close above It

Bharathi Airtel Support and Resistance (SR) Chartthere is a large duration when sirtel stayed in a parallel channel and then broke out with.a two head and shoulder which eventually moved to a growth channel. With the analysis I feel for me target would be 1772 and stoploss 1550. Please do your analysis and let me know what you guys think

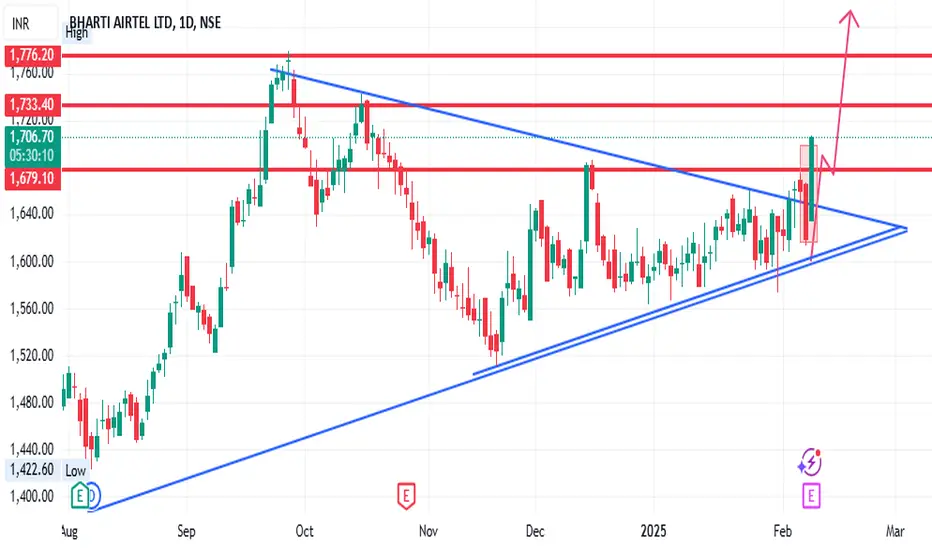
Bharti airtel breakout symmertical tringle Bharti airtel breakout symmertical tringle now it make new high...
Bharti Airtel Trade Setup | High-Risk, High-Reward OpportunityHere's an exciting analysis of Bharti Airtel Ltd based on the chart! 📊🚀
🔥 Trade Setup & Key Levels
📥 Entry Zone: 1657 - 1674 (Smart buy zone)
🛑 Stop-Loss (SL): 1592 (Risk protection)
🎯 Target Profits (TP):
TP1: 1737 (First milestone 🥇)
TP2: 1778 (Stronger bullish push 📈)
TP3: 1858 (Big breakout potential 💥)
📌 Observations & Strategy
Current Price: 1619.75 (-2.45%) 📉 → Price is below the entry zone, meaning a potential bounce or more downside.
RSI & Indicators: Oversold conditions ⚠️ → Possible buyer interest soon!
Risk-Reward Ratio: A great setup with a high reward vs. risk trade! 🔥
🚀 What’s Exciting?
If support at 1592 holds, we could see a bullish explosion 🚀🔥
A break above 1657 might trigger a rally toward 1737+ levels 📈💰
If 1592 breaks down, a deeper fall might be in play ⚠️📉
This setup is high-risk, high-reward—perfect for traders looking for a strong breakout move! 💎 What do you think? 🤔
⚠ Disclaimer: I am not SEBI registered. Stocks and securities are subject to market risk 📉📈. Please read all levels carefully before making any trading decisions.
📊 Follow for more insights & trade setups! 🚀

BHARTI AIRTEL MID-TERM ANALYSISBharti Airtel can continue with its upside momentum, and once it crosses and sustains above 1710, it can give good upside momentum, and 1766 will be the level which can take Bharti Airtel into blue sky territory of 1900-2000+ . The most pessimistic level on the chart would be 1297 in the mid-term. All levels are marked in the chart posted.
