Bharti Airtel in near to support levels around 420Bharti Airtel in near to support levels around 420
BHARTIARTL trade ideas


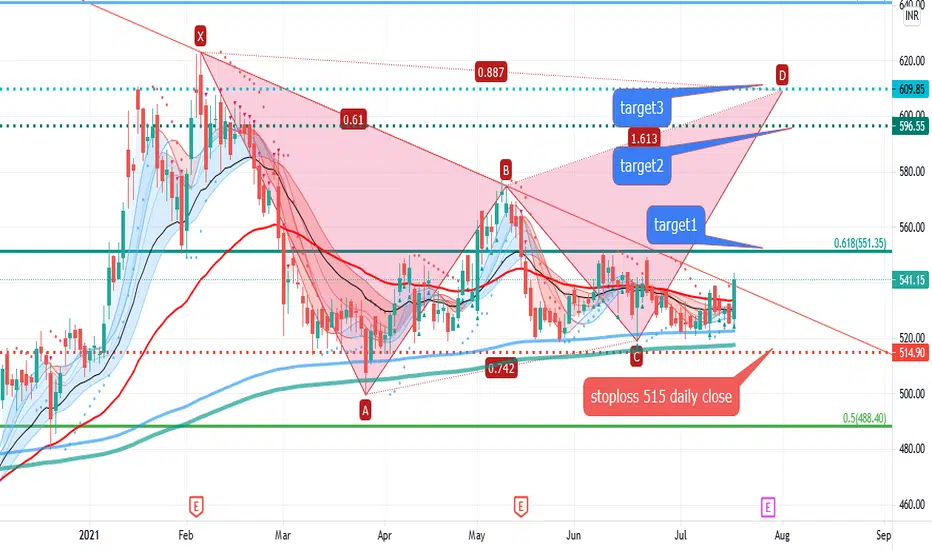
Bharti AirtelGood for a positional trade.
Buy at a retest.
Long consolidation breakout.
Target- 575 , 610
Stop loss- 515


Bharti Airtel Ltd BreakoutBharti Airtel Ltd Triangle Pattern Form
taken multi level Support
Wait for Breakout


Airtel....... 539 ???Bulls will rule if breakout above 539
levels marked
happy trading......
Like.. Share... Follow...


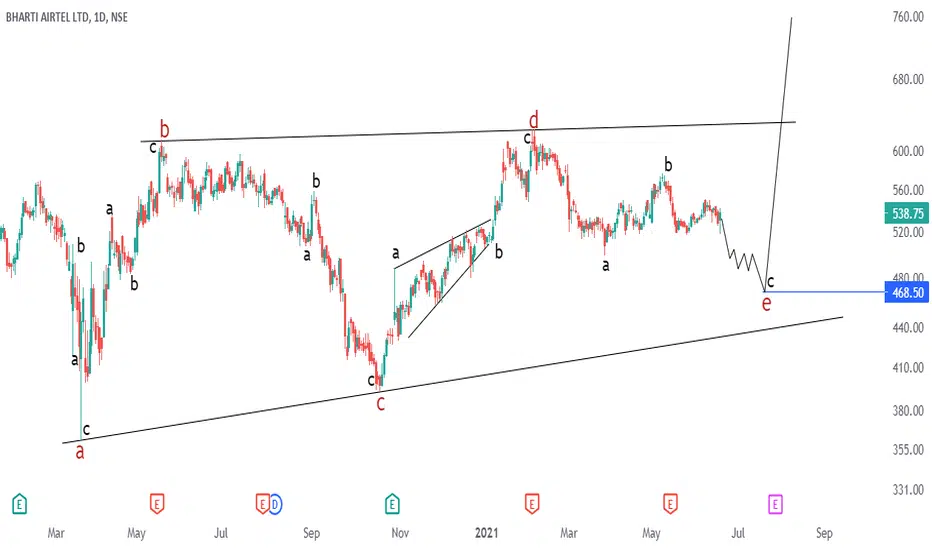
BHARTI AIRTEL SHORT BELOW 518? Hi Everyone, Bharti airtel formed rounding bottom & doji candle on 1D chart. support 517.00 if breaks can go 487.00 & 458.00 level 2.0 of Harmonic ABCD pattern. Above 553.00 pattern invaild & can go 575.00 & 600.00. NSE:BHARTIARTL


Bhartiartl : Long Breaking of channel on 10th May and then Fibonacci retracement upto INR 548 on 9th June is self explanatory and clearly visible
in the chart.
Parallel channel between 7th June and 23th June clearly shows importance of 21 DEMA crossing 200 DEMA - 1st from below on 7th June
which led to increase price action and then from above on 23rd June which led to stock correction.
Therefore 200 DEMA is a major moving resistance for the stock price. Therefore
If 21 DEMA price is above 200 DEMA then 541 is the target to be expected
If 21 DEMA price continue to moves below then 520 is the level which is a strong support for the stock.
Note: I am long in the stock and i am expecting it to rise else will be accumulating more in case it goes down !!

Airtel - Potential BreakoutObservations :
1. Airtel has been moving downwards for a few weeks now.
2. It has tested and respected 200-EMA multiple times (more than 5 times) in such downfall
3. It is currently trading around 200-EMA
4. Volume dry up and loss of momentum can be seen, Usually it is followed by a spike in volumes and a super-move (either side)
5. After looking at candles and overall chart structure an Ascending Triangle with upper trend line + 200-EMA line can be formed. It indicates a higher probability of an UP MOVE in coming weeks
6. Along with 200-EMA, price has been respecting the Fibonacci Levels of 50% & 61.8% too. (For fibo - use weekly chart and draw fibo levels from inception of the up trend)
7. Multiple supports (demand zones) below CMP and probability of an up move after triangle breakout makes it a potential breakout candidate
Risk Reward Ratio is 2.5 times or more. (Expected Profit is 2.5 times more than expected loss)
Keep an eye on the price action. Ideal buy would be above 545/550 levels subject to high volume breakout.
Do you analysis.
Thanks

Bhartiairtel looking bulishIt's not a investment advise it's only for educational purpose please do your own research before invest.

Long BhartiairtelThis is not a investment advice it is only for educational purpose. please do your own research before invest

Bharti Airtel Head and Shoulder Bharti airtel has formed a perfect head and shoulder pattern in the daily time frame. On top to bottom analysis, it can be seen that it has got a rejection from the trendline on 5 min time frame.

Bharti Airtel came out of triangle on 1 DAirtel looks like will go for a breakout . Keep any eye.
Simple price action, no Jazz!

Bharti airtel break out the trendlineBharti is in breakout position with some good candles and volume and rsi also show some good momentum in uppercase let's watch and for breakout and targets are bow
Buy At 542 sl is 515 and targets are 1st 554 and 2nd 573 and final is 623

BHARTIARTL ready for breakout !???BHARTIARTL: formed asymmetrical triangle and price pushed to apex . Is it ready to go UP???