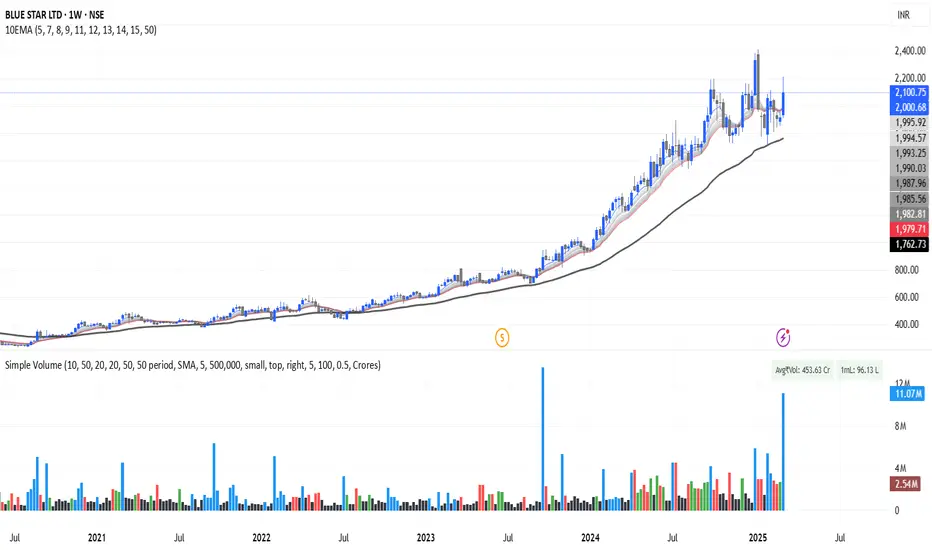
$NSE:BLUESTARCO trading within a range! Near support levels!NSE:BLUESTARCO is showing range bound movement with current levels near support. Overall company prospects over short and long term are good.
Given that P/E multiples are high, growth has been accounted for. Should remain in the range for sometime till P/E eases a bit (with Revenue and PAT growth).
Over longer term, even if the price comes down, it's a good buy bet IMO.
BLUESTARCO trade ideas

Blue Star Ltd (Slow and steady wins the race)Blue star manufacturers air purifiers, air coolers, water purifiers, cold storage and speciality products. The Company offers turnkey solutions in MEP (Mechanical, Electrical, Plumbing, and Fire-fighting) Projects. It is the largest after-sales service provider for air conditioning and commercial refrigeration products in the country.
Key Points :-
Business Segments
1 Electro-Mechanical Projects: Large central AC & ventilation projects, Fire-fighting projects, Water projects, Plumbing projects, Electrical projects and Railway electrification.
2 Commercial Air Conditioning: Blue Star is the market leader in Conventional and Inverter Ducted Air Conditioning Systems and Scroll Chillers and is at the second position in VRFs and Screw Chillers
3 Unitary products: ACs, Air Coolers, Water Purifiers, Commercial Refrigeration etc. Products available in 8,800 outlets in 650+ locations.
4 Professional Electronics and Industrial Systems (PE&IS): Specialized Technology Solutions, Engineered Turnkey Projects, Value-Enhancing Services, MedTech Solutions, Data
Security Solutions, Industrial Solutions.
BLUE STAR CUP & HANDLE PATTERNentry will be considered only above 2400 with good volumes & with strong close of daily candle.
fisrt target will be 2763
SL will be the low of handle

Blue Star - Cup Pattern BreakoutBlue Star Ltd.
Cup Pattern Breakout.
Crossing All Time High.
High Volume & Delivery.
Potential Uptrend.
Disclaimer:
For educational purpose only.
Please do your own research before taking any trades.
Happy Trading!

POV : BLUESTARCO : Fractal BreakoutPOV : BLUESTARCO : Fractal Breakout
Chart Reading:
1. Price was stuck in 17 sessions of the 7th November day's Range.
2. Daily and Weekly Trends and Momentum are bullish.
3. Previous 2 Fractals (Double Top) breakout
For educational purposes only. This is not financial advice. Please consult a professional before making financial decisions.
#NiVYAMi

Jan 1st, 2025 Breakout stocks📊 Stock Analysis: TAJGVK
Key Highlights: 💡⚡
• 📈 VCP Breakout identified on the daily chart, indicating a bullish trend.
• 📈 Strong Price Action: The stock has shown significant upward movement and consolidated well prior to the breakout.
• 📈 Volume Spike: A notable increase in volume at the breakout point adds to the strength of this signal.
• 📈 MACD Crossover: This indicator suggests a favorable shift in momentum.
• 📈 Ideal for Swing Traders: This setup presents a promising opportunity for short-term trades.
🚀 Trade Setup:
• Buy Trigger: Above 442 DCB
• Current Market Price (C.M.P): 441
• 🎯 Target: 30% potential upside
• ⚠️ Stop Loss: 15% to manage risk effectively
Important Reminders:
• Always exit trades before significant events to mitigate risk.
• Maintain a disciplined risk-to-reward ratio for long-term success.
If you found this analysis helpful, please like and follow for more insights and trading strategies! ✅
Disclaimer: I am not a SEBI Registered Advisor. This post is for educational and informational purposes only.
Eat🍜 Sleep😴 TradingView📈 Repeat 🔁
Wishing you all successful trading and continuous learning with MMT! Cheers! 🥂

BLUESTAR Cup & Handle Pattern
RSI Above 60 daily / Weekly /Monthly
Volume Growth
2098 Support
Expected Level 2450 / 2657

BLUE STAR LTDBreakout happend in this stock with rising 200dma and RS indicator is also showing strength.
Keep your risk and reward ratios according to your own preferance.
This is for educational purpose, do your own research before investing.

Bull on bluestarBluestar making a cup and handle pattern with bullish RSI and favorable volumes, A good breakout is needed.

Blue Star Ltd. - Long Setup (Swing Trade)Blue Star Ltd. has approached a key level, presenting a potential swing trade setup. Here’s the trade plan:
Entry Zone: 1880
Entry Price: Once a 15-minute candle breaks above 1880 , the high of that candle will confirm the entry.
Target: 2048.50
Stop Loss: 1795.80 (Triggered if a daily candle closes below this level)
The stock is currently testing the entry zone at 1880 , and if there’s a confirmed breakout, we could see momentum driving it toward the target of 2048.50 . The stop loss at 1795.80 offers a controlled risk, providing a favorable risk-reward ratio for this setup.
Disclaimer: This post is for educational purposes only and is not financial advice. Always manage your risk and trade responsibly.

Blue Star Ltd Daily Chart Analysis
The daily chart of Blue Star Ltd displays a mixed trend with visible levels of support, resistance, and clear price action signals, indicative of potential breakout and pullback scenarios.
Price Action Highlights:
1. Trend Analysis: The stock appears to have been trading within a broad channel, with recent price movements consolidating near a key zone. Multiple trend lines intersect, indicating potential breakout and support zones.
2. Support and Resistance Levels:
•Support: The key support level lies around ₹1,775.60, which has previously acted as a strong base for buyers. A breakdown below this level may signal further weakness.
•Resistance: Immediate resistance levels are seen around ₹1,888.90 and ₹1,905.80, with a longer-term resistance at ₹2,007.80. A breakout above these levels with strong volume could indicate a bullish reversal.
3.Volume Analysis: The recent spike in volume suggests heightened market activity, typically associated with significant moves. High volume on bullish days can confirm buying interest, whereas volume surges on bearish days may signal distribution.
4.Price Pattern Formation: The chart shows a potential wedge or pennant formation, which often precedes a breakout in either direction. Watching how the price reacts around support and resistance levels will be crucial for determining direction.
5.EMA Levels: The stock is currently trading around the 13, 48, and 200 EMAs, indicating mixed sentiment. A sustained move above these averages, particularly the 200 EMA, would suggest stronger bullish momentum.
6.RSI Indicator: The RSI is around 42.46, indicating the stock is in the lower half of the range, showing mild bearish to neutral momentum. If RSI moves below 40, further bearish pressure could be expected. Conversely, a rise above 50 could indicate a potential bullish reversal.
Potential Scenarios:
•Bullish Case: A breakout above ₹1,888.90 with strong volume may signal a bullish reversal, targeting ₹2,007.80 and higher in the coming weeks.
•Bearish Case: A breakdown below the support of ₹1,775.60 could lead to further downside, potentially testing the lower trendline support around ₹1,600.
Summary: Blue Star Ltd is at a crucial juncture, with price action signaling potential for both breakout and consolidation. Traders should closely watch volume, support, and resistance interactions to gauge the direction of the next move.
Disclaimer: This analysis is for educational purposes only and should not be considered as financial or trading advice. Please conduct your own research or consult with a financial advisor before making any trading decisions.

BlueStarCo Soars from 747.95 to 1926: All Targets Reached!BlueStarCo has shown a remarkable bullish run since entering at 747.95 on 6th September 2023. The price has not only reached all take profit targets but also surged far beyond expectations, currently trading at 1926.
Key Levels:
Entry: 747.95 – This marked the point where the bullish momentum took hold.
Stop-Loss (SL): 724.85 – Positioned below the entry to minimize downside risk.
Take Profit 1 (TP1): 776.55 – Reached early in the trade, confirming a strong start.
Take Profit 2 (TP2): 822.80 – Hit as the upward momentum continued.
Take Profit 3 (TP3): 869.10 – Met, indicating strong sustained buying pressure.
Take Profit 4 (TP4): 897.65 – Final target hit, followed by a significant price surge beyond all targets.
Trend Analysis:
The price action has been well-supported by the Risological dotted trendline, confirming a consistent uptrend. The continuous rise from the entry point shows no signs of reversal, with the current price sitting at 1926, nearly doubling the initial entry value. Traders who held on to this trade have seen tremendous returns, and further gains are still possible as the momentum remains strong.

BLUE STAR LTD S/R Support and Resistance Levels:
Support Levels: These are price points (green line/shade) where a downward trend may be halted due to a concentration of buying interest. Imagine them as a safety net where buyers step in, preventing further decline.
Resistance Levels: Conversely, resistance levels (red line/shade) are where upward trends might stall due to increased selling interest. They act like a ceiling where sellers come in to push prices down.
Breakouts:
Bullish Breakout: When the price moves above resistance, it often indicates strong buying interest and the potential for a continued uptrend. Traders may view this as a signal to buy or hold.
Bearish Breakout: When the price falls below support, it can signal strong selling interest and the potential for a continued downtrend. Traders might see this as a cue to sell or avoid buying.
20 EMA (Exponential Moving Average):
Above 20 EMA(50 EMA): If the stock price is above the 20 EMA, it suggests a potential uptrend or bullish momentum.
Below 20 EMA: If the stock price is below the 20 EMA, it indicates a potential downtrend or bearish momentum.
Trendline: A trendline is a straight line drawn on a chart to represent the general direction of a data point set.
Uptrend Line: Drawn by connecting the lows in an upward trend. Indicates that the price is moving higher over time. Acts as a support level, where prices tend to bounce upward.
Downtrend Line: Drawn by connecting the highs in a downward trend. Indicates that the price is moving lower over time. It acts as a resistance level, where prices tend to drop.
RSI: RSI readings greater than the 70 level are overbought territory, and RSI readings lower than the 30 level are considered oversold territory.
Combining RSI with Support and Resistance:
Support Level: This is a price level where a stock tends to find buying interest, preventing it from falling further. If RSI is showing an oversold condition (below 30) and the price is near or at a strong support level, it could be a good buy signal.
Resistance Level: This is a price level where a stock tends to find selling interest, preventing it from rising further. If RSI is showing an overbought condition (above 70) and the price is near or at a strong resistance level, it could be a signal to sell or short the asset.
Disclaimer:
I am not a SEBI registered. The information provided here is for learning purposes only and should not be interpreted as financial advice. Consider the broader market context and consult with a qualified financial advisor before making investment decisions.

Blue star LongBluestar
MTF Analysis
BluestarYearly Demand Breakout 1029
Bluestar 6 Month Demand Breakout 1038
BluestarQtrly Demand Breakout 1795
BluestarMonthly Demand 1897
BluestarWeekly Demand 1988
ENTRY -1 1988
SL 1843
RISK 145
Potential Target 2838
First Target Points 2481
First recovery Target Points 638
Last Swing Low 1562
Last Swing High 2200
RR 4
RR 43%

Breakout ATH after good consolodation Enter at Rs.2112 on 26,Sept 2024.
Reason : ATH, breakout,with good volume delivery.

BLUE STAR Approaching Breakout! 📈 Strong ascending trendline support, breakout watch above ₹1,901.50
🎯 Next target: ₹1,950

BLUE STAR - Short Trade - Target 2 Done!BLUE STAR - Short Trade - Target 2 Done!
Entry at 1721
Stoploss: 1744
Trailing stoploss: 1705
Potential to reach 1582
Potential profit: 7.7%
Profit so far: 3.6%
Current status: Hold the short trade with trailing stoploss set at 1705
Please consider following for more tips, trade setups and analysis.
Namaste!

Review and plan for 9th August 2024Nifty future and banknifty future analysis and intraday plan in kannada.
stocks to watch...
This video is for information/education purpose only. you are 100% responsible for any actions you take by reading/viewing this post.
please consult your financial advisor before taking any action.
----Vinaykumar hiremath, CMT

BLUESTAR: A Gem with a resistance 💎Keeping it simple as always:
🎯 Strong financial indicators 💪🏻
🎯 Growth rates ⬆️
🎯 ROE & ROCE ⬆️
🎯 Green Quarter ⬆️
🎯 Huge Volume Spurt on both Breakout and Retest ⬆️
🎯 Increasing spreads between 50, 100, and 200 EMA ⬆️
🎯 A resistance is holding it back⬇️
🎯 1000 level will be a crucial level ❗
If you'd like to request an educational analysis, simply send us 100 coins as a token, and we'll be happy to post one for you.
⚠️Disclaimer: We are not registered advisors. The views expressed here are merely personal opinions. Irrespective of the language used, Nothing mentioned here should be considered as advice or recommendation. Please consult with your financial advisors before making any investment decisions. Like everybody else, we too can be wrong at times ✌🏻

Blue Star Blue Star is forming flag n pole pattern in daily time frame. Keep an eye on it. View is for educational purpose only.


