BRIGADE ENTERPRISES IN its buying zoneBRIGADE ENTERPRISE is now in buying zone as per analysis it will move till 1480, so lets see what happens it will rebound or not>>>???watch observe price action
BRIGADE trade ideas

BRIGADE : Is it ready to build a new tower?** Chart Analysis: What’s Happening?
The chart shows a classic Elliott Wave setup with a potential swing trading opportunity. Here’s the breakdown:
Elliott Wave Structure :
The price appears to have completed a corrective wave (labeled as A-B-C) around the Correction Wave Completion Zone of 937-972. This zone acted as a strong support area, where the price found a base after a sharp decline.
Point b (A) marks the end of the corrective wave, followed by a liquidity buildup at the support zone . This often signals a reversal as buyers step in, absorbing selling pressure.
Key Levels :
Support Zone (937-972) : This is where the price reversed, indicating strong buying interest. The note on the chart mentions that a "break up or break down can lead to price movement," which aligns with the breakout we’re seeing.
First Swing Target (1,049) : The price has already broken above the support zone and is heading toward this target.
Second Swing Target (1,258-1,296) : This is the next major resistance zone, where the price could face selling pressure if the bullish momentum continues.
Stop Loss (Day Close Below 900) : A critical level to protect against a failed setup. A daily close below 900 would invalidate the bullish thesis.
Current Price Action :
The price is currently at 939.35 (as of March 19, 2023), showing a slight decline of -0.75 (-0.08%). However, it’s still above the support zone, indicating that the bullish setup remains intact.
The chart shows a breakout above the corrective wave structure, with the price testing higher levels after the reversal at point (A).
** Plan of Action: How to Trade This Setup
Based on the chart, here’s a step-by-step plan for swing trading BRIGADE :
Entry Point :
The price has already broken above the correction wave completion zone (937-972). A good entry would be on a pullback to this zone (around 950-970) with confirmation of support (e.g., a bullish candlestick pattern like a hammer or engulfing candle). Alternatively, aggressive traders can enter on a breakout retest above 950 with strong volume.
Target 1 (1,049) :
This is the first swing target. If the price reaches this level, consider booking partial profits (e.g., 50% of your position) to lock in gains, as this level may act as resistance.
Target 2 (1,258-1,296) :
If the momentum continues, aim for the second swing target. This is a significant resistance zone, so expect potential profit-taking or a reversal here. Be ready to exit the remaining position if signs of weakness appear (e.g., bearish divergence on RSI or a shooting star candlestick).
Stop Loss :
Set a stop loss on a daily close below 900 , as indicated on the chart. This ensures you’re protected if the price breaks down and the setup fails.
** Risk Management Tips for Options Trading
Since this is a swing trading setup, options can be a great way to leverage the move while managing risk. Here are some tips:
Choose the Right Strike :
If you’re buying a call option, select a strike price near the current price (e.g., 950 or 1000 strike) to balance cost and potential returns. Avoid deep out-of-the-money (OTM) options, as they have a lower probability of success.
Position Sizing :
Never risk more than 1-2% of your trading capital on a single trade. For example, if your account size is ₹5,00,000, your maximum risk should be ₹5,000-10,000. Calculate your position size based on the difference between your entry and stop loss.
Time Decay (Theta) :
Options lose value as expiration approaches. Choose an expiration date that gives the trade enough time to play out—preferably 30-45 days out for a swing trade like this.
Use Stop Losses :
Even with options, set a mental stop loss based on the underlying stock price (e.g., a daily close below 900). If the trade goes against you, exit the option position to avoid further losses.
Avoid Over-Leveraging :
Options can be tempting due to their leverage, but don’t overexpose yourself. Stick to a small position size to manage risk effectively.
** Summary and Conclusion
To recap, BRIGADE is showing a promising swing trading setup after completing a corrective wave and breaking out above the 937-972 support zone. The price is targeting 1,049 in the short term, with a potential move to 1,258-1,296 if the bullish momentum continues. A stop loss on a daily close below 900 ensures risk is managed. For options traders, focus on proper strike selection, position sizing, and time decay to maximize returns while minimizing risk.
This setup offers a good risk-reward ratio, but always trade with discipline and a clear plan. Happy trading, and may the markets be in your favor!
** Disclaimer
I am not a SEBI-registered analyst, and this analysis is for educational purposes only. Trading and investing involve risks, and you should consult a financial advisor before making any decisions. Always do your own research and trade at your own risk.

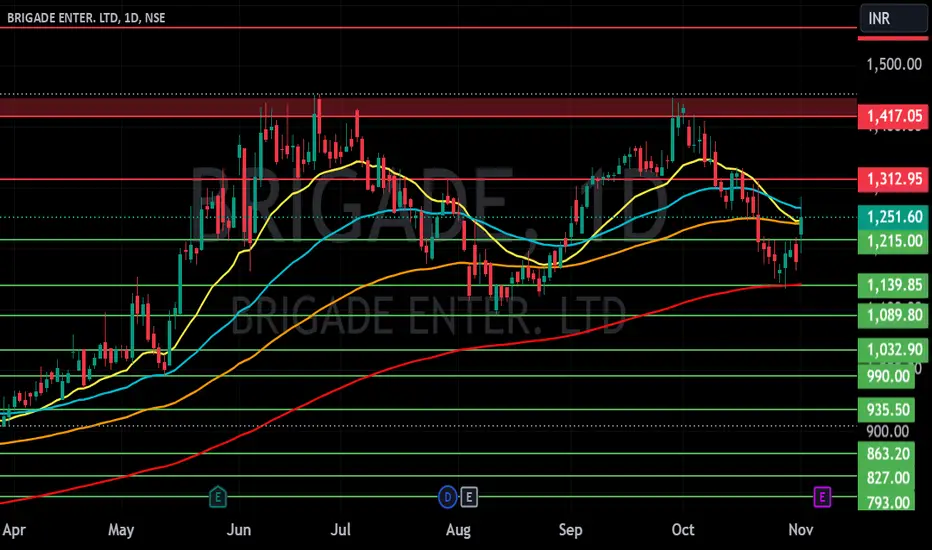
BRIGADE ENTER. LTD S/RSupport and Resistance Levels:
Support Levels: These are price points (green line/shade) where a downward trend may be halted due to a concentration of buying interest. Imagine them as a safety net where buyers step in, preventing further decline.
Resistance Levels: Conversely, resistance levels (red line/shade) are where upward trends might stall due to increased selling interest. They act like a ceiling where sellers come in to push prices down.
Breakouts:
Bullish Breakout: When the price moves above resistance, it often indicates strong buying interest and the potential for a continued uptrend. Traders may view this as a signal to buy or hold.
Bearish Breakout: When the price falls below support, it can signal strong selling interest and the potential for a continued downtrend. Traders might see this as a cue to sell or avoid buying.
20 EMA (Exponential Moving Average):
Above 20 EMA(50 EMA): If the stock price is above the 20 EMA, it suggests a potential uptrend or bullish momentum.
Below 20 EMA: If the stock price is below the 20 EMA, it indicates a potential downtrend or bearish momentum.
Trendline: A trendline is a straight line drawn on a chart to represent the general direction of a data point set.
Uptrend Line: Drawn by connecting the lows in an upward trend. Indicates that the price is moving higher over time. Acts as a support level, where prices tend to bounce upward.
Downtrend Line: Drawn by connecting the highs in a downward trend. Indicates that the price is moving lower over time. It acts as a resistance level, where prices tend to drop.
RSI: RSI readings greater than the 70 level are overbought territory, and RSI readings lower than the 30 level are considered oversold territory.
Combining RSI with Support and Resistance:
Support Level: This is a price level where a stock tends to find buying interest, preventing it from falling further. If RSI is showing an oversold condition (below 30) and the price is near or at a strong support level, it could be a good buy signal.
Resistance Level: This is a price level where a stock tends to find selling interest, preventing it from rising further. If RSI is showing an overbought condition (above 70) and the price is near or at a strong resistance level, it could be a signal to sell or short the asset.
Disclaimer:
I am not a SEBI registered. The information provided here is for learning purposes only and should not be interpreted as financial advice. Consider the broader market context and consult with a qualified financial advisor before making investment decisions.
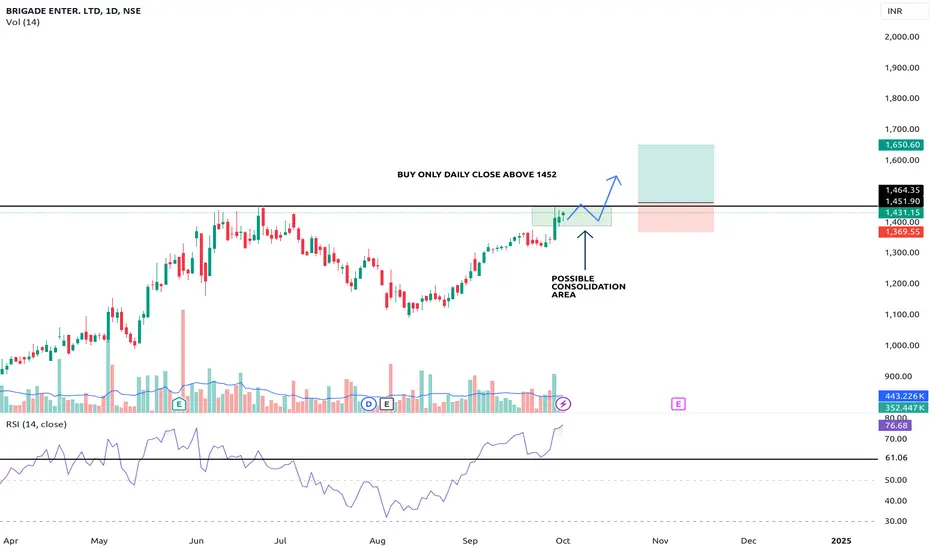
BRIGADE BreakoutBrigade is getting ready to have a break out in short term as per my analysis
BUY ONLY DAILY CLOSE ABOVE 1452
The information provided in this TradingView idea is intended solely for educational purposes and should not be considered as financial or investment advice. All analysis, strategies, and opinions expressed are my own interpretations of the market. Trading and investing involve substantial risk and may not be suitable for every individual. Always conduct your own research, consult with a qualified financial advisor, and consider your own risk tolerance before making any trading decisions. I am not responsible for any financial losses you may incur as a result of following the ideas presented here.

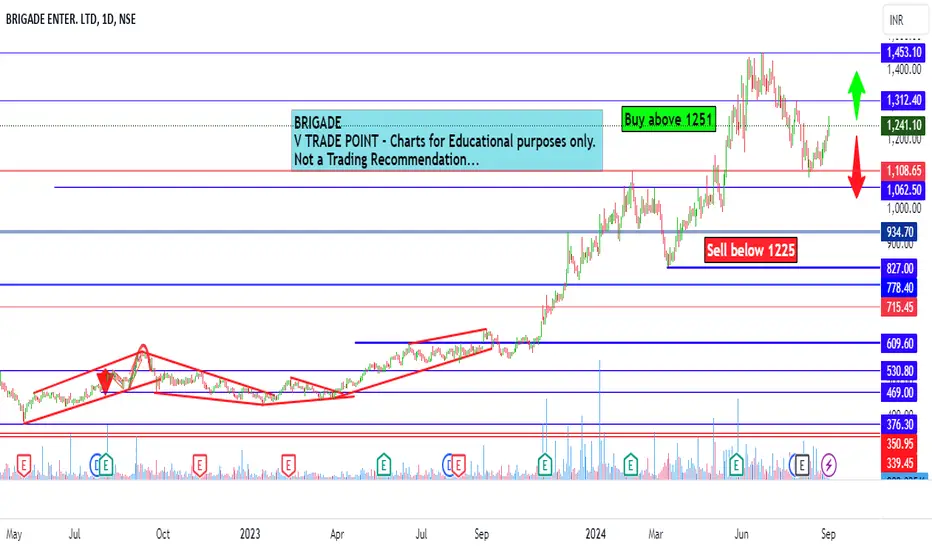
Brigade Enterprises Ltd view for Intraday 3rd September #BRIGADEBrigade Enterprises Ltd view for Intraday 3rd September #BRIGADE
Buying may witness above 1251
Support area 1225.. Below ignoring buying momentum for intraday
Selling may witness below 1225
Resistance area 1251
Above ignoring selling momentum for intraday
Charts for Educational purposes only.
Please follow strict stop loss and risk reward if you follow the level.
Thanks,
V Trade Point
Brigade Enterprises Ltd intraday level for 23rd Aug #BRIGADE Brigade Enterprises Ltd intraday level for 23rd Aug #BRIGADE
Buying may witness above 1158
Support area 1140-1145. Below ignoring buying momentum for intraday
Selling may witness below 1139
Resistance area 1155-1158
Above ignoring selling momentum for intraday
Charts for Educational purposes only.
Please follow strict stop loss and risk reward if you follow the level.
Thanks,
V Trade Point

BRIGADENSE:BRIGADE
Good Stock trading at support level.
Support 1120
Sl 1073
Target 1200/1300/1400
Sowing reversal from support level
Pivot S1- 1144
Rsi - 42

Brigade Enterprises LimitedNext Big move on Brigade Enterprises Limited
For Longs as price is at Key support, wait for Rejection at order block with fair value gap, Wait for the trend line brake with volume. take a lower time frame long entry to increase risk to reward ratio..
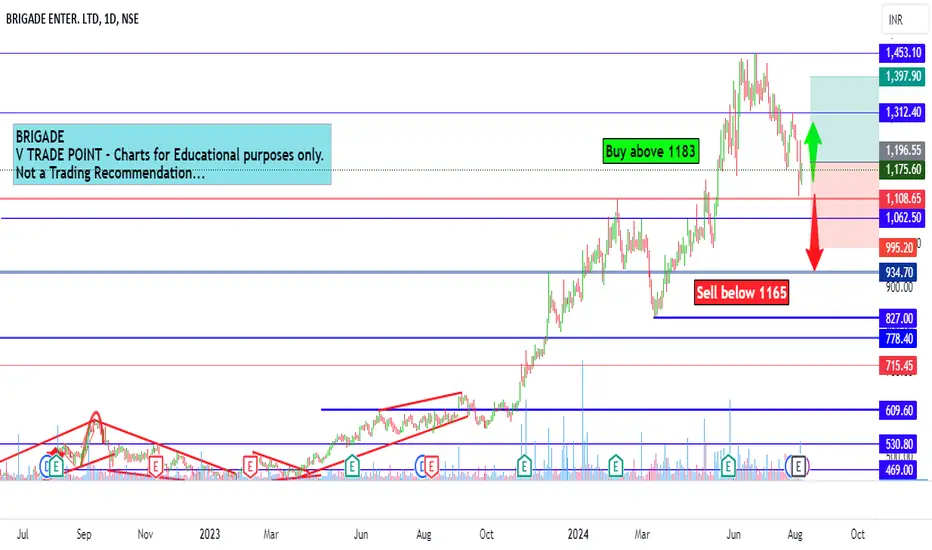
Brigade Enterprises Ltd intraday level for 8th Aug #BRIGADE Brigade Enterprises Ltd intraday level for 8th Aug #BRIGADE
Buying may witness above 1183
Support area 1150-1160. Below ignoring buying momentum for intraday
Selling may witness below 1165
Resistance area 1150. Above ignoring selling momentum for intraday
Charts for Educational purposes only.
Please follow strict stop loss and risk reward if you follow the level.
Thanks,
V Trade Point
Brigade Enterprises Ltd intraday level for 6th Aug #BRIGADE Brigade Enterprises Ltd intraday level for 6th Aug #BRIGADE
Buying may witness above 1140
Support area 1128-1130. Below ignoring buying momentum for intraday
Selling may witness below 1115
Resistance area 1128-1130. Above ignoring selling momentum for intraday
Charts for Educational purposes only.
Please follow strict stop loss and risk reward if you follow the level.
Thanks,
V Trade Point

BRIGADENSE:BRIGADE
One Can Enter Now ! Or Wait for Retest of the Trendline (BO) Or wait For better R:R ratio
Note :
1.One Can Go long with a Strict SL below the Trendline or Swing Low of Daily Candle.
2. Close, should be good and Clean.
3. R:R ratio should be 1 :2 minimum
4. Plan as per your RISK appetite
Disclaimer : You are responsible for your Profits and loss, Shared for Educational purpose

BRIGADEThe stock has finally moving past the Price Rejection Zone with good volume support. The relative strength is positive and increasing. Money Flow is also turning positive. The Stock looks poised to move much higher.

BRIGADE - A stock to watchThe stock is attempting to cross the previous Rejection zone with Buying Climax like Bar. Relative strength, Money flow is positive and increasing. Delivery Volumes in the last two sessions has ben high. If we have a good quality close above 1108 the stock will move much higher. Need some caution here because of the Very high Volume “BC” bar. The BC Bar supply may provide some resistance for further up move albeit for short term.

3 Years completed for Flag Pattern Simple Flag Pattern In stock where completed 3 years consolidation.

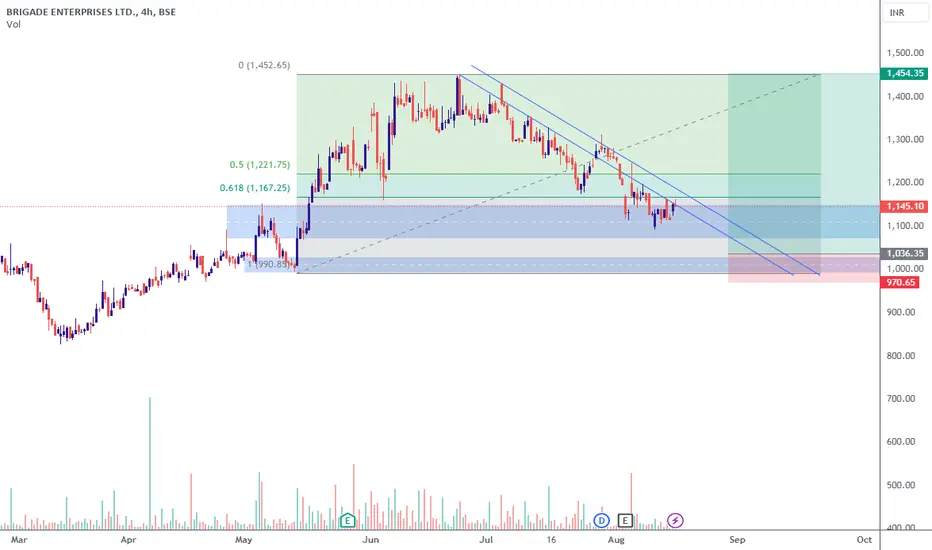
BRIGADE, positioned for upward momentumMarket trends and dynamics further support BRIGADE's upward trajectory.
BRIGADE currently follows an upward trajectory within an identifiable uptrend parallel channel. This pattern signifies a consistent and positive market sentiment, creating a foundation for anticipated price growth. Traders and investors observing this trend may find strategic entry points at the lower boundary, capitalizing on the stock's predictable oscillations. BRIGADE's adherence to this channel suggests a favorable environment for further upward movement, making it an intriguing prospect for those seeking potential market gains.

Brigade enterprisesStock is in a uptrend shown by higher, higher lows. Retracement from recent highs is followed by good buying and avwap squeeze. stock is likely to continue its uptrend.

BRIGADE - UpdateAs anticipated in my last post the stock moved up. Up by 10% now. Negotiating another supply area now. All favorable conditions remain the same. Above 750 the stock will move up much further.

Resistance Breakout - BRIGADEPlease look into the chart for a detailed understanding.
Consider these for short-term & swing trades with 2% profit.
For BTST trades consider booking
target for 1% - 2%
For long-term trades look out for resistance drawn above closing.
Please consider these ideas for educational purpose
Please note that, if there are some big targets, those are drawn thinking for long term.

BRIGADE – Poised to Go Higher ?The stock after facing a “BC” bar retraced to the sub 50 DMA levels. Then recovered and moving past the supply shadow of the “BC Bar and making a new high. The relative and absolute strength are positive. There is also Money coming into the stock. The delivery volumes are high indicating committed buying. The poised to go higher.

BRIGADE - Stock Analysis**Technical Analysis:**
Brigade Enterprises Limited displays several promising technical signals that suggest a bullish trend. The PriceVol indicator is "Bullish," signaling a rising price accompanied by increasing trading volume in recent sessions. The HighLow indicator is "Strong Bullish," as the company has achieved a new one-year high and is trading with robust volume support. The OneDay signal also shows "Strong Bullish," indicating a recent strong price rise backed by healthy trading volume.
Additionally, various technical indicators are giving positive signals. The PSAR is "Bullish" with a bullish crossover and sustainability. The KeltnerBand, MACD, DonchianBand, HighLowBand, AwesomeOscillator, MAChannelBand, BOLLINGER, and Supertrend all display "Bullish" signals, with positive breakouts and sustained trends. The StochRsiSmooth, while in a textbook overbought level, suggests a "Bullish" signal, indicating a strong uptrend. Furthermore, the SlowStoChastic is also in the overbought level but reinforces the bullish sentiment by signaling a strong uptrend. The ADX is "Bullish," trending upward.
**Candlestick / Heikin Ashi Patterns:**
The daily candlestick pattern is "Bullish," indicating a continuation of the bullish trend. The weekly candlestick pattern is "Strong Bullish," as a bullish Heikin Ashi pattern has formed with high trading volume. The monthly candlestick pattern is "Bullish," showing the initiation of a bullish Heikin Ashi pattern.
**Fundamental Metrics:**
Fundamentally, Brigade Enterprises Limited demonstrates promising metrics. The company is trading below its intrinsic value with a Price to Intrinsic Value ratio of 0.483. The book value has been trending upward over the past three years, indicating a strengthening financial position. The Piotroski F Score is an excellent value of 8.0, reflecting strong financial health. Annual net profit has been on an upward trajectory for the past three years, and EBITDA has shown continuous growth over the same period. Notably, the year-over-year net margin has jumped by a substantial 129.37%.
Total assets have been steadily increasing over the past three years, further indicating the company's growth and stability. The debt-to-equity ratio has decreased and is now at its lowest level in the last three years, portraying a sound financial position. A decreasing debt load coupled with increasing revenue is a promising financial trend.
Based on the comprehensive analysis, the recommendation for potential investors is to "Go Long" on Brigade Enterprises Limited when the stock price rises above 675, with a suggested stop loss at 581.80. It's important to exercise caution and consider other market conditions and your individual financial goals before making any investment decisions.

Brigade EnterprisesThe stock is in an Uptrend followed by a consolidation pattern which is a ascending triangle pattern. The target for this script is very attractive and hence a very good risk reward trade. All the levels are marked on the chart. Any further development will be posted here.

Brigade long side Simple price action analysis . Stock is in uptrend and bounced back with good volumes from the support zone .
expecting 5% to 10% from the current levels in short term
