CAMS Long_Support at 20 DEMA_Hidden Bullish DivergenceCAMS Long:
- Price takes support at 20 DEMA
- Hidden bullish Divergence
- First time price tests 50/ 20 DEMA after Golden Crossover
- Enter Long when the price is favorable in lower timeframe
- SL: close below 20 DEMA
CAMS trade ideas

Computer Age Management BuyComputer Age Management took support at trend line. Price crosses above 200-DMA and golden crossover. Buy @CMP (4225) with Sl of 4090 and target of 4340, 4770, 4930 & 5300.

breaking up soon The cup and handle pattern is a bullish technical formation that signals a potential continuation of an upward trend in an asset's price
good to enter and small SL📊 Chart Overview
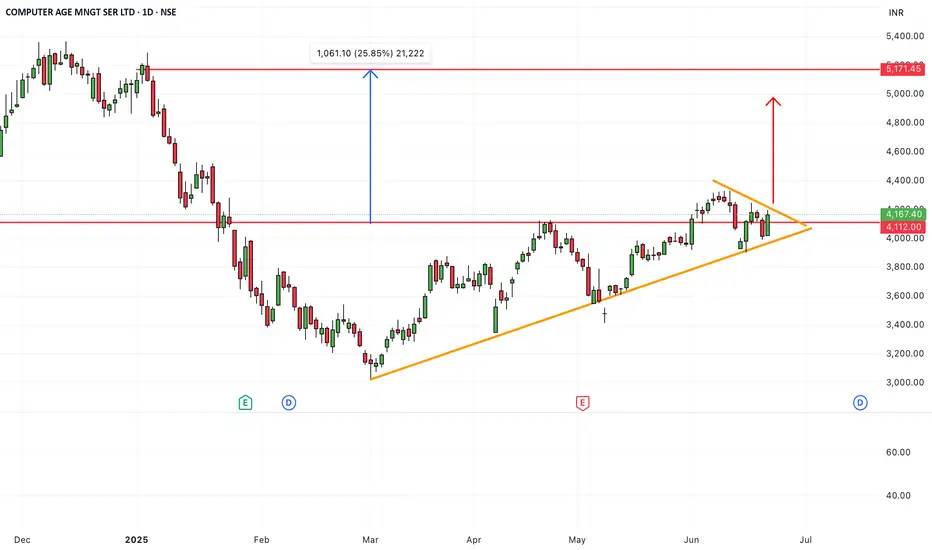
CMP: ₹4,167.40
Day’s Range: ₹4,020.00 – ₹4,199.00
Change: +₹152.60 (+3.80%)
Trendline: Price is respecting a strong upward trendline, acting as dynamic support.
🔍 Technical Insights
Trendline Support:
Multiple touches on the trendline with today's candle bouncing off it = strong confirmation of bullish support.
Today's bullish candle with high volume at trendline adds conviction.
Volume Surge:
The bullish day is supported by increasing volume—an indication of institutional or smart money buying at support.
Structure:
The stock has made higher lows consistently, showing strength.
Short-term consolidation in the ₹4,000–₹4,250 range, now showing breakout potential.
Next Resistance Zones:
₹4,250–4,300: Recent highs and minor hurdle
₹4,500+: Next potential target if breakout is confirmed
₹4,850–5,000: Major resistance from earlier downtrend
✅ Buying Strategy Suggestion
Aggressive Buy (Since it bounced on trendline):
Buy now (₹4,160–₹4,200) with SL below trendline support (₹3,980)
Target 1: ₹4,300
Target 2: ₹4,500+
Conservative Buy:
Wait for a breakout above ₹4,300 with volume
Entry on retest of breakout or during momentum
SL: ₹4,100
Targets: ₹4,500 → ₹4,800+
⚠️ Risk Notes
A breakdown of the trendline with volume invalidates this setup
Keep a tight stop below trendline (₹3,950–₹3,980 zone)
Broader market weakness can impact short-term moves

CAMS – Rounding Bottom Breakout | Momentum PlayStructure:
CAMS has completed a classic rounding bottom formation over the past three months, with the neckline placed around ₹4,200. Price action from the March 2025 lows (~₹3,100) has remained within a well-defined ascending channel, signaling steady accumulation and controlled institutional entry.
On June 5, 2025, the stock gave a clean breakout above ₹4,200 with a strong bullish candle, closing at ₹4,248.30. Importantly, the move came with a volume of 877.56K, significantly higher than the 20-day average (576K), validating the breakout strength.
Momentum indicators are supportive — RSI has now crossed 70, confirming entry into bullish momentum territory without showing divergence or exhaustion yet.
Breakout Snapshot:
Pattern: Rounding Bottom + Ascending Channel
Breakout Level: ₹4,200
Entry: ₹4,248.30 (EOD Jun 5, 2025)
Volume: 877.56K vs 20-SMA 576K
RSI: 70.11 → strong bullish confirmation
🎯 Target: ₹5,120
📉 Stop-Loss: ₹4,000 (below breakout and channel support)
📈 Potential Upside: ~20%
⚖️ Risk-Reward: ~3.6x
Why It Matters:
CAMS has historically respected multi-month consolidations and offers clean post-breakout runs when supported by volume. This setup reflects a transition from accumulation to trend. The ascending structure indicates that smart money entered gradually — now validated with the breakout and volume spike.
Not a call to chase — idea is based on price-volume confirmation after a long base formation. Ideal entries are either near breakout (done) or on retest toward ₹4,180–₹4,200.
Track These:
₹4,400: Minor resistance
₹5,120: Measured move target
₹4,000: Invalidation zone
RSI > 75: Overheat caution
Disclaimer:
This analysis is for educational and informational purposes only. It does not constitute investment advice or a recommendation to buy or sell any security. Please consult your financial advisor before making any trading decisions.

CAMS_Long_TrendPrice Showing strength with good volume on June 2 &3rd.
Crossed key resistance/ swing highs.
Looks good for long with tight SL
(Probably 4125 Support level on close basis)
Disc: Educational Purpose only

CAMS_LongPrice above 200 DEMA,
Price crosses key Resistance (Monthly)
with decent volume in Daily Chart
Enter with tight SL
Disc: Educational Purpose only

CAMS ( COMPUTER AGE MANAGEMNET SERVICE)Cams break out from its range after consolidation of almost 22 months which is very long consolidation to adjust its price. after break out some retracement is there. See for price action here if green candle on daily time frame it will be a buy for the target of all time high.
sl will be 2473.
Target near 4000
volume are gud and supported by 20 MA.
Risk reward ratio and probability is only the holy grail in the market.
Dont lose more than your entry reason.

CAMS CMP 1545. (POSITIONAL)Super strong fundamental and at affordable price with the ROCE- 49% and ROE -40%. Operating Profit Margin 40%.And a highest institutional Holding.Add this to your portfolio.For long term with Finding RISK REWARD.On daily candle RSI showing it entering in bullish zone.Keep watching.

CAMS - a breakout CAMS
The stock has come out of the basing formation. The patten looks like a head and shoulder in the making.
A move towards 4000 levels can be expected, if the rally sustains in the broader index.

Is CAMS Seeing a Trend Reversal? What Comes Next...?CAMS is currently experiencing support at the multi-year level of 3,400 rupees. Recently, it has broken through its trendline, raising the question of whether it will sustain this breakout and potentially reverse the overall trend. At this stage, it’s prudent to monitor the situation to see if a reversal occurs. If a breakout is confirmed, a long position could be considered around the retest level of 3,700 rupees. The first target for this position would be approximately 4,000 rupees, with the second and third targets at 4,200 and 4,500 rupees, respectively.

Plan for 20th December 2024 Nifty future and banknifty future analysis and intraday plan.
Swing idea in stock.
This video is for information/education purpose only. you are 100% responsible for any actions you take by reading/viewing this post.
please consult your financial advisor before taking any action.
----Vinaykumar hiremath, CMT

CAMS !! Towards bigger target now#CAMS
- Breakout of 4060 level is done
- Re-test is done
- Consolidation post breakout is done
-HEADING Towards bigger target of 6100

CAMS Swing Long SetupEnter only when 15minute candle closes above the Entry Zone Price - 4447.95
Target with Risk to reward 1:2 is 5243.85
Stoploss only when 1 day candle closes below the price - 4050
Note: This is not any financial advice, this is for education purpose only.

CAMS NSE 3Y RBC Breakout MTF/WTFCAMS has formed a 3Year Rounding bottom Cup( RBC) with. High Volume creating a new All Tile High (ATH) and 52W ATH on the Weekly and Monthly time Frame (WTF/MTF)
Price is currently above 21EMA and 21EMA is above 50 and 200 respectively suggesting a Bullish Trend
CAMS is trading above the 50% FIBO Retracement Range
CAMS is currently consolidating in a Range, Enter when Range is broken on WTF.
SL below thw consolidation Range @4200. enter with 25% Quantity when price touches @4300..Add progressively. at higher Close

CAMS: light, Cams, Action?Need to close above 4700 on WTF, this will confirm the BO. The scrip will run 5300 odds and after that it will an open sky.

CAMS: light, Cams, Action?Need to close above 4700 on WTF, this will confirm the BO. The scrip will run 5300 odds and after that it will an open sky.

Symmetrical Triangle Formation in CAMS – Awaiting BreakoutOverview:
CAMS is currently forming a symmetrical triangle on the daily chart, a classic continuation pattern. This pattern typically indicates a period of consolidation before the next significant move, and given the stock’s strong previous uptrend, there is a potential for an upward breakout. However, the symmetrical triangle is neutral until confirmed, so both bullish and bearish breakouts are possible.
Pattern Breakdown:
The triangle is defined by point A (around 4900 INR), where the stock reached a high, and point B (around 3850 INR), marking the recent low. The price has been forming lower highs C (around 4600 INR) and higher lows D (around 4200 INR) as it tightens into the apex.
This contraction in price is a sign that the market is undecided, but once it breaks out of the triangle, a directional move is expected.
Key Observations:
RSI Oscillator:
The RSI, set to a period of 14, is hovering around the neutral zone (~50). This shows that the stock isn’t currently overbought or oversold. A move above 70 or below 30 could signal a strong trend in the direction of the breakout.
Volume Decline:
As the triangle develops, volume has been tapering off, a typical characteristic of consolidation. A significant volume spike will be key in confirming the breakout direction.
Breakout Levels:
Upside Breakout: A break above point C (around 4,600 INR) could trigger a bullish continuation, given the previous uptrend. Traders should wait for confirmation via price action and volume.
Downside Breakout: A breakdown below point D (around 4,200 INR) could signal a bearish reversal, especially if accompanied by increased volume.
Final Thoughts:
Symmetrical triangles can break in either direction, so it's crucial to wait for confirmation. Given the prior bullish trend in CAMS, there's a greater probability for an upward breakout, but the possibility of a downside move can’t be ruled out. Patience is key—monitor the volume and price action carefully for a strong breakout signal.
Disclaimer :
This is for educational purpose only. I am not SEBI registered advisor. Take advice from financial advisor before investing.

Cup completed now HANDLE with careThe cup formation for the pattern is completed now may try to form handle and breakout after that.
Follow @JSwingTrades on X

CAMS LONGCAMS has formed a rounding bottom technical pattern, has already given a breakout, retested and is now consolidating, once it start it's move it has a potential of 50% upside (differs upon your buying price).

CAMS 3 YEAR BREAKOUT 🎉 CAMS Breakout of 3 Years! 🚀
CAMS: CAMS is India's largest Mutual Fund Transfer Agency, providing services and statements for mutual funds, AIFs, insurance companies, banks, and NBFCs.
I'm excited to share my analysis on CAMS, showcasing a promising long-term positional buy:
Current Market Price: 4186
Stop Loss: 3000
Targets: 4780 and 6500
Analysis and Reasoning:
Pattern: Rounding Bottom Breakout
Breakout Timeframe: Monthly
Calculation: The rounding bottom spans from 2037 to 4067, indicating a potential gain of almost 2000 points. This projects a target of approximately 6100 (4067 + 2000).
This milestone is a testament to my dedication, hard work, and strategic planning in market analysis. I'm passionate about identifying and leveraging market opportunities to achieve financial goals.
Note: I am not a SEBI registered analyst. Please consult with a financial advisor before making any investment decisions.
#Achievement #Success #Milestone #CAMS #MarketAnalysis #InvestmentStrategy #RoundingBottom #Breakout #LongTermInvestment #FinancialPlanning

Camps Multi year BOA monopoly stock
Good consolidation and u pattern BO
Financials are good
Stable upwards momentum
Entry and exits are given in chart
Good for positional trade

camsPlease consult your financial advisor before investing
All research for educational purposes only.
