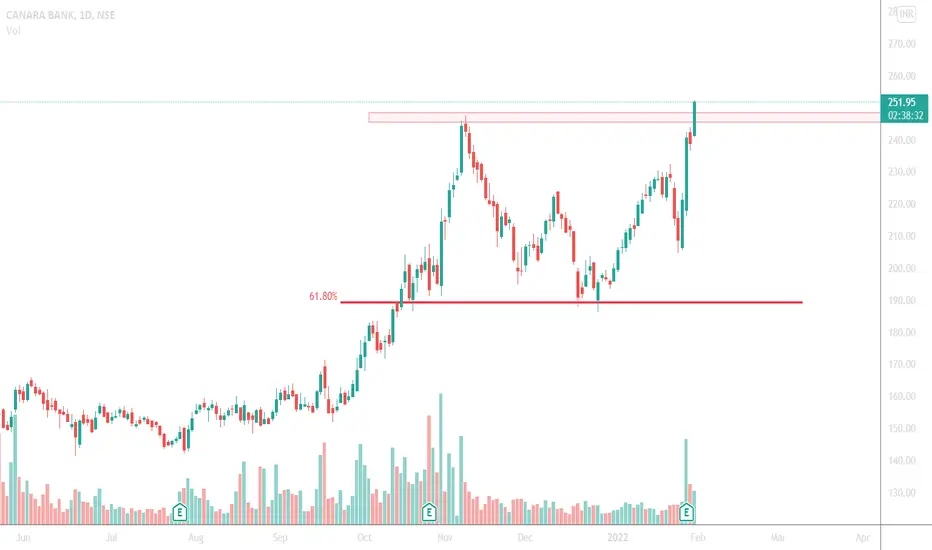
CANARA BANK BUY short termTP will be updated soon
wait for 1D close
breakout trade and also its in a strong trend
CANBK trade ideas
Canara Bank 1 MTflook like breakout previous resistance at 2020. May move up to 290 if bank-nifty supports

Canara Bank Long Term View Positive Canara Bank Long Term View Positive Can give long target as shown in chart

CANARA BANKit breaks the downc hannel pattern on the upper side, but on friday it forms the spinning top candle
so wait for the price to cross the 215 level, and then go for long side

Canara Bank For Intraday 20 of December 2021I have drawn some trade lines to identify the entry for both sides buy and short sell in the stock
Red trade line is the support and green trade line is the resistance


CANARA BANK stock for Intraday for 8th of DecemberMy strategy is very simple short below major support and buy above major resistance

Negative divergence exit longs Canara bank making negative divergence on Daily time frame exit longs.

Canara Bank : OverviewDaily RSI above 50
Support of EMA 20, 50 and 200
Formation of Rounding Bottom Pattern
Will reach for retest level of 170 after reaching 230.

Canara bankCanara bank good long term bet
Support at 140
Fir objectives of 300+++
Long term targets 500/800+++

CANBK LONGCanbk looks very strong here
Support at 140
For objectives of 300+++
Long term targets 500/800++++

Canara bank long with tgt of 140 / cmp 109 / SL 99CANARABANK long will achive TGT of 140 keep SL 99.
HIDOI11017%andHGAOI10007.05%
#EDUCATIONALIDEA

CANBK waiting for Resistance Breakout CANBK waiting for Resistance Breakout
all estimate based on weekly close
Target : 200
Entry above : 167
Exit : 140

Canara long term for buyingStudy purposes only I have publishing this chart
If taken entry your own risk

Canara BankCanara bank on a weekly timeframe
Stage 2 Breakout from a stiff resistance zone which was earlier a support zone.
May continue uptrend till it remains above 30WEMA. May proceed toward targets of 233/290.
Only for educational purposes, not a recommendation.

CANARA BANKCanara bank looking good on chart. its gave breakout before couple of days with huge then retest breakout with low volume. Now again Canara is showing strength with good volume.

Canbk showing bullish sign in daily time frame.canbk given breakout and after retesting it shows bulish sign for good entry at the level of 175 in 1hr time frame

longits going to move high likely as chart suggest and
a gud breakout of trend line ,let it retest and enter around 175
target- 183
SL-171
time -1-2 week

Canara Bank following bullish trend Strong support @ 165 - 160 levels
Retest may possible to 170.. 165
190 expected target before December.

CANARA BANK WEEKLY CHART ascending triangle pattern , 180-185 will be big hurdle zone , if crossed and sustain for couple of days , then we might see 220-225 , best buy zone 165

Canara Bank : BULLISH MomentumSome Quantity buy at current price 148.
if price comes to 131-130 add more to participate in rally.
Trade Setup: MIT
Target Mention on Chart

buy can bank above 174.60 sl 140 tgt 234canara bank looks very good . after long time buying in psu banks and price is moving above all diagonal lines
