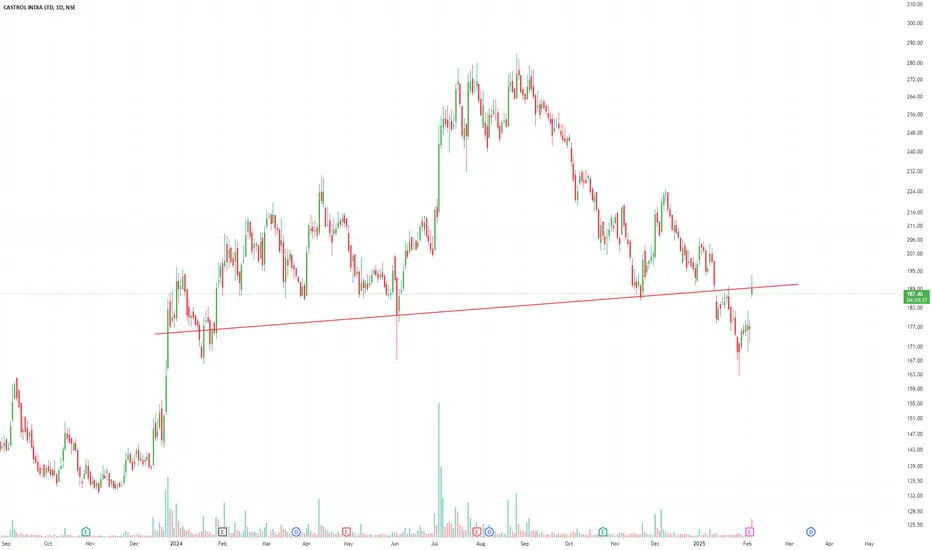
Castrol India Breaks Out After Long Consolidation | Volume-Backe📌 Chart Insights:
Castrol India has just broken out of a falling wedge pattern, signaling a strong bullish momentum. What makes this breakout more convincing is the huge volume spike, confirming the presence of institutional or smart money.
🧠 Technical Highlights:
Pattern: Falling Wedge Breakout
Breakout Volume: 16M+ — highest in weeks ✅
Previous Resistance (₹204) now acting as support
🧭 Final Thoughts:
This setup looks technically strong for swing traders and positional holders. As long as the price holds above ₹204 with continued volume support, upside towards ₹240–245 looks likely in the near term.
CASTROLIND trade ideas

Castrol India - Swing trading setup!Castrol India - Swing trading setup!
Note: This is not a trading recommendation. This analysis is for educational purposes only. We'll know in few days if the price moved as per the study.
It is not advisable to go long when the general market is trending low.

CASTROLIND CMP 215.Castrol India Making a base around 200 levels.Company in fundamentaly strong with Dividend Yield of 3.5%.Price to Earning is 23 With Affordable valuations.Roce around 55% and ROE IS 42%. that shows we can enter in this stock for short term or long term investment also.Risk to Reward is Better.Add to your wachlist and find your best entry exit area own.Thanks for support.

castrolind short term breakout castrolind short term breakout .If this level make strong resistance zone so if break will make atleast 10% return

CASTROL INDIA LTD S/RSupport and Resistance Levels:
Support Levels: These are price points (green line/shade) where a downward trend may be halted due to a concentration of buying interest. Imagine them as a safety net where buyers step in, preventing further decline.
Resistance Levels: Conversely, resistance levels (red line/shade) are where upward trends might stall due to increased selling interest. They act like a ceiling where sellers come in to push prices down.
Breakouts:
Bullish Breakout: When the price moves above resistance, it often indicates strong buying interest and the potential for a continued uptrend. Traders may view this as a signal to buy or hold.
Bearish Breakout: When the price falls below support, it can signal strong selling interest and the potential for a continued downtrend. Traders might see this as a cue to sell or avoid buying.
20 EMA (Exponential Moving Average):
Above 20 EMA(50 EMA): If the stock price is above the 20 EMA, it suggests a potential uptrend or bullish momentum.
Below 20 EMA: If the stock price is below the 20 EMA, it indicates a potential downtrend or bearish momentum.
Trendline: A trendline is a straight line drawn on a chart to represent the general direction of a data point set.
Uptrend Line: Drawn by connecting the lows in an upward trend. Indicates that the price is moving higher over time. Acts as a support level, where prices tend to bounce upward.
Downtrend Line: Drawn by connecting the highs in a downward trend. Indicates that the price is moving lower over time. It acts as a resistance level, where prices tend to drop.
Disclaimer:
I am not a SEBI registered. The information provided here is for learning purposes only and should not be interpreted as financial advice. Consider the broader market context and consult with a qualified financial advisor before making investment decisions.

H&S Breakdown and Retest in CASTROLINDNSE:CASTROLIND formed a slightly tilted H&S followed by breakdown and now retest seem to be in progress. Depending on how the day closes, this could be a nice shorting opportunity.
As per the size of head, target would be around 125. However, due to the left side tilt (which reflects lack of extreme weakness), it would be prudent to go with a smaller fall, if at all this materializes.

Castrol Buy...The Risk reward on the chart please read...CUp and handle breakout...stoploss is supertrend..so ride it to the profit shown..Good break out after a fall

CASTROLIND looks good.CASTROLIND looks good for long side view.This is only for educational purpose.

CASTROL potential breakout - Strong prior uptrend
- VCP formation
- Volume dry-up
- Forming higher lows
- Tight price action
- Low risk entry

CASTROL INDIA5 Year Break out.
Buy above 160 (Weekly close)
Stop Loss- Weekly close below 30 SMA.
Caution:- Buy only above 160 or else it may trap you.


SWING IDEA - CASTROL INDThere seems to be a strong breakout in CASTROL IND . This could potentially be an excellent swing trade.
Reasons are listed below :
Multiple tests on 161 levels and finally the price broke these levels with high volumes.
Marubozu candle (bullish sign) on weekly timeframe.
Breakout after a strong consolidation of 5years .
Stock price is above 50 and 200EMA i.e the trend is intact.
Target - 213 // 242 // 271
StopLoss - weekly closing below 145 levels

CASTROLIND - Castrol India Ltd - Long Term Bullish MomentumCASTROLIND Technical Analysis
The technical outlook for CASTROLIND is currently bullish, with some indicator indicating a strong buy signal. Here's a breakdown of the key points:
Bullish Signs:
As per my observance, technical rating for CASTROLIND is " strong buy " based on various indicators and oscillators. Both their 1 week and 1 month ratings show a strong buy signal.
Positive Breakouts: Recent price movements suggest positive breakouts, indicating upward momentum.
Aroon Indicator: This indicator points towards a potential uptrend move.
Awesome Oscillator: This indicator is trending upwards, signifying a bullish reversal.
Neutral Signs:
Investing.com: Their technical analysis summary includes signals ranging from "strong buy" to "sell" based on various indicators, offering a more neutral overall view.
Overall Trend and My Opinion:
Technical indicators for CASTROLIND are currently leaning bullish. There have been positive breakouts, and oscillators suggest upward momentum. However, it's important to remember that technical analysis should be used in conjunction with other factors, and some analysts might have a more neutral view based on different indicators.
Here are some resources for further research:
TradingView CASTROLIND Technical Analysis:
Investing.com CASTROLIND Technical Analysis:
Top Stock Research CASTROLIND Daily Technical Analysis:
Disclaimer:- Remember, technical analysis is a tool to help you make informed decisions, not a guarantee of future performance. Conduct your own research before making any investment decisions because this is my personal opinion and I am not suggesting anyone to invest because I am not SEBI registered
Thanks for your support as always

LONG,MOVING AVERAGES CROSS OVER CASTROAL INDIA
MOVING AVERAGE CROSS OVER SHORT TERM BUY
ENTERY - 207-210
SL - 196
TARGET- 250
RISK MANAGE
IF 50K CAPITAL
Position size(no of share) 45
Investment of capital 9409.090909
MAX LOSS -500
PROFIT ------(1500-2000)
RISK TO REWARD (1:4)

CASTROL INDIA LEVELS FOR SWING TRADING 18/06/2024STOCKS FOR SWING TRADING (SHORT TERM) 18/06/2024
NO.1
#CASTROLIND
Buy Price - 200 (CMP 203)
SL - 185
TARGET - 230 (15%)
@jagadheeshjp
Disclaimer : All information on this page is for educational purposes only,
we are not SEBI Registered, Please consult a SEBI registered financial advisor for your financial matters before investing And taking any decision. We are not responsible for any profit/loss you made.

Castrol India (NSE: CASTROLIND) ForecastBased on the 4-hour chart for Castrol India (NSE: CASTROLIND), here is the summary:
Key Levels:
- Resistance Zone: 200-210
- Support Zone: 175-185
Current Price:
- Current Price: 187.65
Chart Analysis:
1. Downtrend: The stock has been in a downtrend, as indicated by the descending trendline.
2. Support Zone: The stock has reached a support zone between 175-185, where it has shown some consolidation.
3. Potential Bounce: If the stock finds strong support and breaks above the descending trendline, it could head towards the resistance zone.
- Buy Target (TP): 207
4. Bearish Scenario: If the stock fails to hold the support and breaks below 182.85, it could fall further towards the lower end of the support zone.
- Sell Target (TP): 175
Strategy:
- Wait for Breakout and Weekly Close: It is suggested to wait for a breakout above the descending trendline and a weekly close above this level to confirm the trend reversal before entering a buy position.
- Buy Position: If the stock breaks above the trendline and closes above 190 with good volume, consider buying with a target of 207.
- Sell Position: If the stock breaks below the immediate support level of 182.85, consider selling with a target of 175.
Conclusion:
- The stock is at a critical juncture, and the next few trading sessions will be crucial in determining its direction. Monitoring the price action around the support zone and the descending trendline is essential for making informed trading decisions.

CASTROLIND Rectangular pattern Breakout after good Consolidation.
Volume Buildup .
Good for Short term.
Target 252 , 305 ,360 .
Do Like ,Comment , Follow for regular Updates...
Keep Learning ,Keep Earning...
Disclaimer : This is not a Buy or Sell recommendation. I am not SEBI Registered. Please consult your financial advisor before making any investments . This is for Educational purpose only.

Buy CASTROLIND 167 - 173 SL 160 Tgt 195-220Buy CASTROLIND 167 - 173 SL 160 Tgt 195-220
I am expecting 15-30 % return positional basis on this trade

castrol india 1m time frame buy @133 target @ 157.15, 162.50castrol india 1m time frame buy @133 target @ 157.15, 162.50, 179, 204
triangle breakout
risk reward 1:3
its just a view trade at your own risk
sl@109.80


LONG BET.Hello @JainArpan
Till now
This is the Best Chart which you have asked, which we can discuss so much and learn.
Could be a Slow Tortoise.
All the best.
Gratify if you appreciate the practice then you can like it, share it and
If you want me to investigate any chart for you then would cherish doing that for you.
Thank you for your time and support.
Stay safe.

Castrol India rocket ban chuka haiCastro India rocket ban chuka hai... Multi year resistance ko break kiya and now go goa gone...
