CASTROL..Racing up and ahead BuyCastrol broken out...tgt mentioned based on the pattern break...So buy..Please remember anything breaking out into a new price range after years will zooooom up...so buy
CASTROLIND trade ideas

CASTROLINDIA DAILY CHARTCASTROLINDIA DAILY CHART
Breakout @ 156 Target @ 178-182 (MOB) Support @ 143
This stock has witnessed an ellipse breakout @ 156 levels, MOB projected @ 178-182 levels.
Its only an observation & not any suggestion or recommendation.

Castrol India Castrol India
💠 Expecting 25% returns in short term (3 months)
🔸 Market Cap above 14000 Cr.
🔸 Highest volume in past 18 months.
🔸 Avg 1 wk volume is almost 4 Million.
🔸 Company has a good ROE & ROCE track record above 40%
🔸 Company is almost debt free.
🔸 Stock is trading at same levels of 5 years ago.
🔸 High dividend paying company.
✅ Follow
❤️ Like
♻️ Share

Bullish Breakout for short term1.Stock has given Bullish breakout with volume
2. Stock has taken multiple Support
3. W Pattern

CASTROL INDIA LIMITEDCastrol India Limited Chart is quite strong with Bullish View and looks promising at CMP 147.00.
Patterns are drawn on Monthly Chart and as usual complex & detailed drawing is presented considering all the aspects of the chart.
Targets & SL are as follows:
Tgt 1: 185.00
Tgt 2: 210.00
SL: 120 (Closing Basis)
Market is all about OPPORTUNITY / ENTRY / TIMING !!!!!
Basis some minute observations, chart analysis is made, target and SL is given to understand the core of the subject for learning purpose only.

CASTROLINDCASTROLIND for Investment
Holding Period - 1YEAR+
Stop Loss and targets clearly mentioned
***I am not SEBI Registered. All my charts and analysis are only for educational purpose not for trading purpose.

$CASTROLIND long ideaNSE:CASTROLIND has taken all the FVG and nearing the SL hunted OB with good displacement. this should be turning direction any time . keeping SL as the recent swing low and target as the recent high we can get an easy ~4R trade

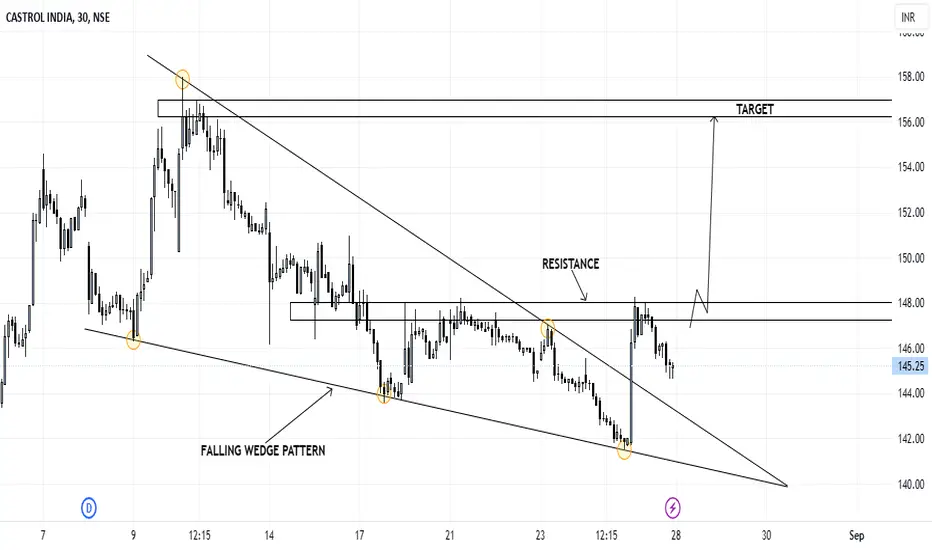
A+++ SETUP WITH 5%+ UPSIDE POTENTIALBreakout of falling wedge pattern has been done on CASTROL INDIA i'm waiting for the breakout and retest of the resistance before taking any long positions.
Expected Target is 157.
CASTROLIND 40% up 🚀🚀🚀🚀NSE:CASTROLIND shared @ 110 and now Trading @ 155.
Enjoy your Profits by book or Trail your SL.

Castrol India 7 Years of falling channel corrected as sideways triangle for 3 years from 2020 to 2023
now that sideways triangle breakout happened and also fundamentally good...

CASTROLIND Triangle pattern in Weekly.CASTROLIND Triangle pattern in Weekly.
Target 150, if there is a breakout.

CASTROLIND 34 % !!NSE:CASTROLIND Shared with SL and now trading @ 153
Book partial or trail your profits.

Castrol India-Nice BreakoutCastrol India-Nice Breakout
Capital to be deployed- 20k
Investing Price -144-145
Breakout Price -143.90
Stoploss -130
Targets -177-198-227
#Castrol #StocksInFocus #StocksToBuy #stockstowatch #stocks #StocksInNews #SwingTrading #BREAKOUTSTOCKS

CASTROLIND-DAILY/WEEKLY/MONTHLY-BREAKOUTNSE:CASTROLIND
Stock is consolidating in a channel from past 8 years. From last year it’s started to making higher low in weekly/Monthly Chart.
Monthly : As per monthly analysis stock has shown a bullish engulfing at bottom levels.
Weekly:
• June 2nd week we can see a big green candle engulfing past multiple weeks.
• June 3rd week there is rejection candle (Inverted Hammer). Things get interesting over here. The rejection candle didn’t get follow through.
• If we look carefully whole week the stock was trading between the range. July first week we can see a boom!
Daily: We can see buying from 122-123 levels from last few days and on Friday (7th July) We can see a big green candle with good volume.
It’s good time to go long for 155-160 targets.
SL: 117
I have already taken this trade.
This is only for educational purpose, please manage your risk accordingly.


CASTROLIND Descending Triangle !!NSE:CASTROLIND
#NSE:CASTROLIND monthly time zone formed beautiful descending triangle,
Entering in to high potential support zone. Marked the levels.

CASTROL has a target of 159/160stock is heading up to 159/160 level which is the confluence of white trend line, yellow trend line, D point of AB=CD pattern and R3 PP..

CATROL RETEST AFTER BREAKOUTCastrol breakout its resistance with volume and retested. There may be a chance of uptrend if market support
Castrol India dont miss out on this one.Castrol India, a good news driven moment started. Entering into EV space. Breaking the horizontal boundary. Look for entry into it.
I have few quantities from the beginning of rally and will be adding more after this level sustains.


I bought Castrol IndiaI bought Castrol India
Candles above 100 & 200 EMA
RSI bullish
Manual trend is bullish as well
SL 95
T1 115+ and T2 open
I think we may witness a strong up move in 3 to 6 months

CASTROL INDIA - Looks GoodThere is been a positive shift in the price structure of the stock.
Sustaining 110 levels, the stock is probably moving towards 125 - 130 levels in the coming weeks.
Trade type: Positional long call

Castrol India ShortStock in downtrend journey, expecting to go further down.
Short at CMP. Target : 103 to 104 level
