Central BankSEBI-Disclosure for Stock Analysis
For Informational Purposes Only: The analysis provided above is for educational and informational purposes only and is based on the technical interpretation of the supplied stock chart. It should not be construed as financial advice, investment advice, or a recommendation to buy, sell, or hold any security.
Not a Financial Advisor: I am an AI assistant and not a registered or qualified financial advisor, investment advisor, or stockbroker. The information presented is generated without considering your individual financial situation, risk tolerance, or investment objectives.
Risk of Loss: Trading and investing in financial markets, including equities, carry a significant risk of loss. The value of stocks can fluctuate, and you may lose part or all of your investment. Past performance is not indicative of future results.
Consult a Professional: Before making any investment decisions, you should conduct your own thorough research and/or consult with a qualified financial professional to assess your personal circumstances and the suitability of any investment.
Information Accuracy: While this analysis is based on the data visible in the chart, it does not account for all possible market variables, including fundamental factors (like company earnings, debt, management) or macroeconomic events (like interest rate changes, government policies) that can impact the stock's price.
CENTRALBK trade ideas
Analyzing Central Bank of India's Bullish Breakout PatternAnalyzing Central Bank of India's Bullish Breakout Pattern: Key Insights, Target Projections, and Entry Point Strategy
The Central Bank of India stock chart, presented above, reveals a rich tapestry of technical indicators and patterns that suggest a strong potential for a bullish breakout. With a convergence of classic chart patterns, Fibonacci levels, and Elliott Wave counts, this setup provides a strategic opportunity for traders and investors.
1. Cup and Handle Formation
One of the standout features on the chart is the "Cup and Handle" pattern, a bullish setup often hinting at a significant price move. This formation, characterized by a rounded "cup" followed by a consolidation phase ("handle"), typically leads to a breakout above the resistance level once the handle is completed. The breakout from this formation is a positive sign, indicating potential upward momentum for the stock.
2. Inverse Head and Shoulders Pattern
Adding to the bullish case is the presence of an "Inverse Head and Shoulders" pattern, a common reversal signal suggesting the end of a downtrend. This pattern comprises three dips, with the central dip (the head) being the deepest, flanked by two higher shoulders. The recent breakout from the right shoulder signals a likely reversal of the previous bearish trend, indicating the beginning of a new uptrend phase.
3. Elliott Wave Analysis
The chart includes Elliott Wave labeling, which highlights a series of impulsive and corrective waves. Currently, the stock appears to be moving toward Wave 5, often associated with the final upward push in an Elliott Wave sequence. Using Fibonacci extensions, the potential targets for Wave 5 are marked, with key levels around 80.86 INR and 100.45 INR, representing the 1.0 and 1.618 extensions, respectively.
4. Fibonacci Retracement Levels and Key Entry Point
Fibonacci retracement levels offer insight into likely support zones, particularly during pullbacks. Here, the 0.618 retracement level at 43.13 INR serves as a critical support level. This point is especially significant as it coincides with the completion of Wave 4. For investors and traders looking to enter with a strategic advantage, 43.13 INR presents an ideal entry point, providing both a discounted price and strong technical backing as it aligns with the 61.8% Fibonacci retracement level.
Entering around 43.13 INR allows for a well-timed entry during a pullback, potentially maximizing upside gains as the stock resumes its ascent toward the projected targets.
5. Bollinger Bands for Volatility Insights
The Bollinger Bands (BB) overlay adds another layer of analysis by highlighting recent price volatility. The stock's current position near the upper Bollinger Band suggests strong bullish momentum. A breakout above the upper band could further confirm the upward trend, signaling a surge in buying activity that could propel the price toward the target levels.
6. Target Projections
The chart highlights two primary target levels based on Elliott Wave extensions and Fibonacci calculations:
Target 1: 80.86 INR – This level aligns with the initial Fibonacci extension target, offering a conservative target based on the Elliott Wave structure.
Target 2: 100.45 INR – This is the 1.618 Fibonacci extension level, commonly associated with the end of an impulsive wave, representing a more optimistic target.
Both targets represent logical exit points for traders aiming to capitalize on the stock’s potential rally following the identified patterns and breakout points.
Conclusion
The Central Bank of India stock is showing strong bullish potential through a combination of the Cup and Handle, Inverse Head and Shoulders, Elliott Waves, and Fibonacci retracement levels. For those looking to enter this position, 43.13 INR serves as a favorable entry point, supported by the 61.8% retracement at Wave 4. From here, traders can aim for the specified targets at 80.86 INR and 100.45 INR, which align with Fibonacci extension levels and complete the Elliott Wave cycle.
With clearly defined support, entry, and target levels, this technical setup provides a well-rounded strategy for capturing potential gains in Central Bank of India's stock. Traders and investors should watch for confirmations around these key levels and adjust their strategy accordingly to maximize potential returns.
#DYOR

CentralBank-Swing Bullish- Will this support is strong enough?! NSE:CENTRALBK
19.08.2024
Buy 60
Target 66
Stop Loss 56
Risk Reward- 1:1.5
1. Inside bar breakout
2. 200 EMA perfect rejection
3. Price bounced from strong key level(Resistance turned to support)
4. After good uptrend price under consolidation from last 5 months
5. RSI bounced from over sold zone with double bottom.
6. Good volumes in breakout candle

CENTRALBK - Central Bank of India - Strong Bullish MomentumTechnical Analysis of CENTRALBK
As per chart pattern, this stock is in bullish trend in Weekly and Monthly time frames . But consolidating in one hour (H1), Four Hour (H4) and Daily (D1) time frame in symmetrical triangle with few local Support/Resistance and major support/Resistance as mentioned below:-
Local Supports:-
S1 - 57.78
S2 - 54.71
S3 - 52.00
Major Support:-
S4 - 41.79
Local Resistance:-
R1 - 66.89
R2 - 68.32
R3 - 70.04
R4 - 72.75
Major Support:-
R5 - 76.83
This is my personal opinion based on my technical analysis of this stock. You can check this analysis with your own analysis and then decide whether to buy this stock or not. If you buy then buy on every dip to maintain average of this stock so that you can get maximum profit from it.
Start Buying at CMP@62 and safe Buy above 64 as mentioned on the chart
All major points are mentioned below and also on the chart itself.
But I am Bullish in this stock from short term to long term investment plan
Do your own research before buying this stock as I am not SEBI registered person
Thanks for your support as always

CENTRALBKLooks good on Charts.
Volume Buildup seen in all PSU Banks.
Above all Key EMA.
Short term target 77 , 92.
Do Like ,Comment , Follow for regular Updates...
Keep Learning ,Keep Earning...
Disclaimer : This is not a Buy or Sell recommendation. I am not SEBI Registered. Please consult your financial advisor before making any investments . This is for Educational purpose only.

central bank of india-1dfibo is best tool for long term pick up and exit stratergy.
central bank of india break out 30 level target trail every weekly basis.
education purpose only.

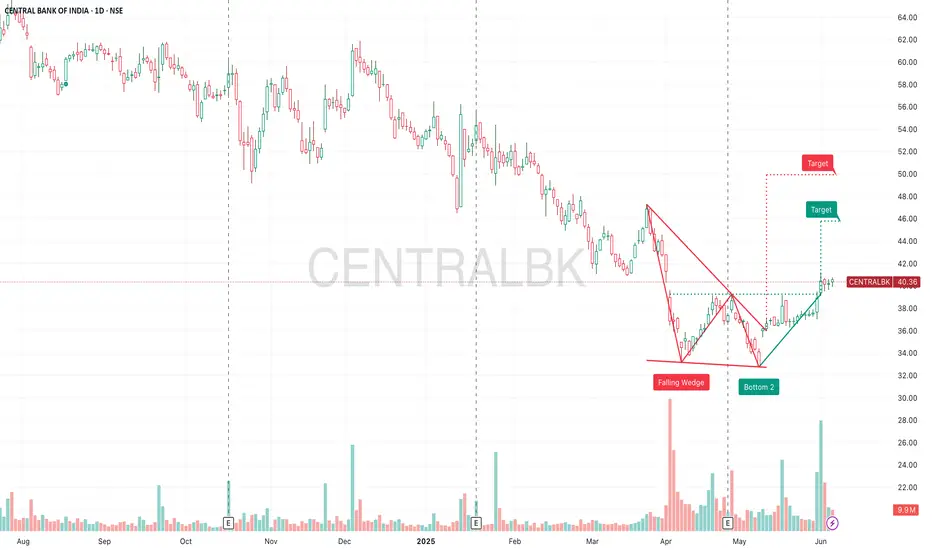
Central Bank of India with good ROI A rounding bottom pattern gave a good breakout with massive volume, the stock is again retesting the breakout level, and once the volumes kick in again, it will be a buy signal.
Buy - 41-44
Tgt - i) 10% (swing)
ii) 40% (short-term)
Stoploss - 3%
-- DISCLAIMER --
I am not a financial advisor or SEBI-registered.
This is just a view.
Please DO YOUR OWN RESEARCH before investing in any stock
Happy trading
Peace

Central bank of india Buy this gem for long term and short term profit
Log term target will be double

CENTRALBK - Central Bank of IndiaAs per previous chart history and current position of this stock, it is indicating to buy at CMP or wait for a dip to enter on reversal. Fundamentals are strong of this stock.
Buy at low with target at 49.90, 50.65, 51.90, 53.45, 55, 57.95
All major points are mentioned on the chart itself
Do your own research because I am not SEBI registered person and this is my personal opinion about this stock
Thanks for your support as always

Central Bank Of India Breakout Level 51.2Central Bank Of India make a breakout and also retest is also done
Above 51.2 central bank of india will go for a test of new levels i.e approx 100-110
Increase in volume seen

Central bank of india ⚡Strong volumes in psu bank + merger news
Potential to cross 100+ in long term
For short to swing 65+ target seen .

Buy Central Bank of indiaBuy above 50 rs
For the target of 110rs
If u want tip for
1.positional trade
2.swing trade
3.intraday trade
I will charge 2000 rs monthly
For see my performance
I will give u free demo for 1 month
Contact me 82696 13561

Central Bank of india
Target 61 - 82 - 92 levels - Once it crossed 61 Trail stoploss
Fundamentals
Market Cap
₹ 44,924 Cr.
Current Price
₹ 51.8
High / Low
₹ 56.0 / 18.6
Stock P/E
23.6
Book Value
₹ 33.7
Dividend Yield
0.00 %
ROCE
4.29 %
ROE
5.92 %
Face Value
₹ 10.0
Promoter holding
93.1 %
EPS last year
₹ 1.93
EPS latest quarter
₹ 0.57
Debt
₹ 3,68,109 Cr.
Pledged percentage
0.00 %
Net CF
₹ -8,995 Cr.
Price to Cash Flow
-5.11
Free Cash Flow
₹ -8,995 Cr.
Debt to equity
12.6
OPM last year
50.2 %
OPM 5Year
47.0 %
Reserves
₹ 20,536 Cr.
Price to book value
1.54
Int Coverage
1.23
PEG Ratio
1.28
Price to Sales
1.64
Sales growth 3Years
2.72 %
Profit Var 3Yrs
49.9 %

Stage-1 breakoutPSU index is at an all-time high and stocks emerging from long-term stage 1 breakout with huge volume with an RSI of more than 80 indicates strength in the stocks and a change in trend.

CENTRALBANKThese are swing idea's which you can add your watchlist and analysis for yourself.
Keep on radar.
Potential upside stock!
This content for only education purpose!
I am not SEBI Register.

Central Bank of India long set upCentral Bank Of India looking bullish. One can clearly identifies Cup and Handle pattern on weekly time frame. If we measure the cup depth, it would be the target on up side which is 65.50 in this case.
Very small stop loss with high risk reward ratio over 6. One can stretch the stop loss below previous swing low.
RSI is above 60 on daily, weekly and monthly time frame.

Central Bank target 60 rs by the end on OctoberAs chart shows up trend of the stock, previous jump from 11rs to 42rs, this time if same move come after going above 37 then this stock can touch 60rs.
This is not a trade or investment advice.

CENTRALBKBuy Entry @ 18
Target @ 33
Stop Loss @ 13
Note: Please leave comments for any query.
Disclaimer: This is my trading experience, it is not an invite or recommendation to trade.
Best of luck..
Shakthi


CENTRAL BANK OF INDIAInverse H&S pattern T-33.50 & 41.50
TARGET 1-33.50 achived today
setting to go for for second target after todays breakout?

Double bottom or Cup with handle Central Bank ready give up move and psu bank index also breakout 12 after years so conder for up move
*Information purpose and knowledge purpose
*Not any recommendations

CENTRAL BANK TRADING NEAR MAJOR SUPPORTCENTRAL BANK TRADING NEAR MAJOR STRUCTURAL SUPPORT
Market is currently trading in a Bullish Trend market structure.
It is expected to remain bullish for few upcoming trading sessions.
Market may touch the targets of 31.00 in near future.
On lower side 26.00 will act as a major support zone for the market.

BULLISH MOMENTUM! Clear confluence, Read below.
NSE:CENTRALBK
Date: 03/07/2023
---
Disclaimer: This is just my observation, please do not consider this idea as financial advise. It is important that each individual should due his/her own due diligence before taking a financial decision, more so in the money markets!
---
The uptrend seen in the chart is reflected in the RSI. This indicates a good upward momentum. This is by using RSI as a momentum gauge rather than a "overbought and oversold" gauge.
The trend has bullish breakthrough in the triangle pattern.
After the recent bullish change of character, we can see that today as of me writing this idea, there is a bullish break of structure. This provides a strong chance of bullish momentum in the coming days.
The price has tested the 21 and 50 day SMA's and risen past it in the past few days with stride.
Price is still in the mid discount zone. Decent entry point.
The above points proves a confluence of bullish momentum
Take profit would be taken in reference to previous highs as this would serve as a passive resistance zone.
TAKE PROFIT 1 = 31.2
TAKE PROFIT 2 = 33.4
TAKE PROFIT 3 = 34.5
Advisable not to go beyond as the area is not strongly tested.
Good luck!
