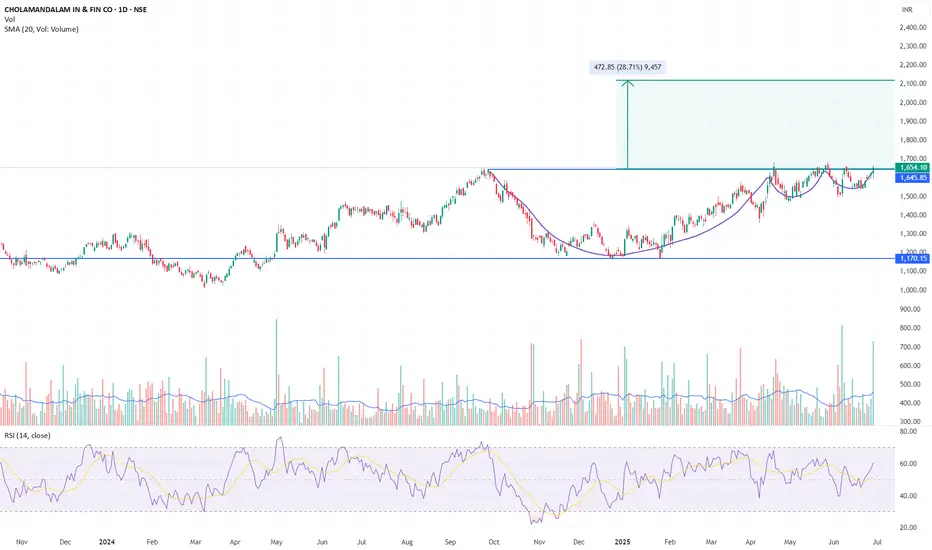
CHOLAFIN – Cup & Handle Breakout | Target ₹2120 (28% Upside)CHOLAMANDALAM FIN has confirmed a classic Cup and Handle breakout after 9 months of base formation. The neckline at ₹1645.85 has been cleanly crossed with strong follow-through and high volume.
Pattern Structure:
Cup Base: Formed between Sep–Dec 2024, bottomed near ₹1170
Handle: Shallow, corrective structure in May 2025 — ideal proportion
Breakout Zone: ₹1645.85 (horizontal resistance since Sep 2023)
Breakout Candle: Strong close at ₹1654.10 with high conviction volume (5.84M vs 2.3M avg)
Trade Setup:
Entry: Confirmed on breakout close above ₹1645
Target: ₹1645.85 + ₹472.85 = ₹2120
Stop Loss: ₹1545 (below handle low)
Risk-Reward: ~1:2.5 for positional traders
Indicators:
Volume: Significant spike, validating breakout
RSI: 60.2 and rising — bullish, not overbought
Moving Averages: Price well above 20 SMA, momentum aligned
Bias & Strategy:
Structure favours long-only positioning. Ideal for trend followers. Breakout is supported by volume and proper consolidation. Short-term pullbacks toward ₹1645–₹1620 can offer re-entry. Avoid shorting — this is the start of a fresh leg higher.
Disclaimer:
This analysis is shared strictly for educational and informational purposes. It does not constitute investment advice, nor is it a recommendation to buy, sell, or hold any securities. You are advised to perform their own due diligence, assess risk tolerance, and consult a registered financial advisor before making any investment decisions.
CHOLAFIN trade ideas
Cholamandalam Investment and Finance Company (CHOLAFIN)I'm not a SEBI REGISTERED ANYLISIS
just for learning purpose
above the blue line close in D chart candle i will buy and put strictly SL to below red line...once candle close below Red line in D chart...i will close the Trade...
target check the chart
educational purpose only
its simple ORB WITH VOLUME BREAKOUT STRATEGY...with small condition apply for selecting the stocks
owt not response for your profit and loss

CHOLAFIN CMP 1428.On daily candle it breaking a range with consolidation breakout.Finance sector also positive.YOY and QOQ company gaining it net profit and EPS.Currently trading at PE of 30.Add this to your portfolio for coming days.And see how it perform.Thank You.

Ready to move all time high'smake a higher highs stock in uptrend.
From 1530-1500 range can expect up move. till 1830 then you can trail later target

CHOLA FIN - SHORT TO MID TERM OUTLOOKChola fin is looking steady on charts and it has a good potential for upside in the short to medium term. The base level for upside would be 1485, and up on crossing this level, we can expect it to continue momentum upto levels of 1656-1716. On the downside, the important support area is 1415-1360, and imp. short covering levels are 1309 and 1258. The view remains invalidated if Chola fin breaches 1250 on the downside.
NOT A BUY/SELL RECOMMENDATION.

Cholamandalam: Bouncing Back After Correction?Cholamandalam Investment & Finance Company has been recovering after a period of decline. The price had fallen around 14% from its highest level in the past year but recently showed signs of regaining strength.
A rounded formation can be seen where the stock gradually stopped falling and then started moving up again. Currently, it is trading around ₹1,414, which is near a key level where it has faced some resistance before.
The overall trend in the past year has been a mix of strong upward movement, followed by a correction, and now a possible attempt to regain lost ground. The next few weeks will determine if the price continues to hold this momentum.
Disclaimer
"Not SEBI registered. This is for educational purposes only, not financial advice. Do your own research before investing."
#StockMarket, #Trading, #Investment, #TechnicalAnalysis, #ChartPatterns, #StockMarketIndia, #PriceAction, #MovingAverages, #SupportAndResistance, #SwingTrading, #NSE, #BSE, #FERMENTABiotech, #VolumeAnalysis, #TrendReversal, #StockMarketEducation, #FinancialMarkets, #IndianStockMarket, #WealthBuilding

Upcoming days Day by day downside flow Enter 1400 and above put side
Strong enter below 1320
Target 🎯 1 - 1200
Final target 🎯 - 1143
Stoploss 1398 day closing

CHOLAFIN - A clear triple bottomCHOLAFIN has formed a clear triple bottom.
Keep this stock in your watch list and watch-out for a break-out with strong volume around the upper blue line. ( Strong resistance)

Cholamandalam: Trendline Breakout with Bullish MomentumCholamandalam is showing a strong trendline breakout, trading at ₹1,320.25, up by 3.83% for the day. Here's a closer look at the recent price action:
📈 Technical Insights:
Downtrend Break: The stock has broken a long-standing downward trendline, suggesting a shift in market sentiment.
Volume Surge: A notable increase in volume (4.58M) indicates strong participation.
RSI in Bullish Zone: RSI has crossed above 61, reflecting improving momentum.
🟢 Key Levels to Watch:
Resistance Zone: ₹1,350
Support Zone: ₹1,280 (trendline retest)
💡 OutLook: The breakout and accompanying volume suggest increased interest in the stock, which could pave the way for further movement. You may monitor the key levels for confirmation of sustained momentum or potential retracement.

Chola Finance Forming Shark / CypherChola Finance is at verge to form M pattern of Shark / Cypher,
It has potential to go towards below targets as per pattern,
Target1: 1140
Target2: 1085
Target3: 1000
Weekly close is important to have above targets.

cholafin Swing TradeHello,
Trend-Based Analysis. Buy the Dips, Sell The Rallies, Also Following the Trend. Let's see where the Price Action takes us, Riding the wave. Potential trade setups based on trend momentum.
Technical analysis based on trend identification and momentum, Looking for high-probability setups within the prevailing trend.
Analyzing the current market trend and potential future price movement. Focusing on risk management and reward-to-risk ratios.
Details is Mentioned in Chart, Read carefully.. .

Cholafin view for Intraday 21st Nov #CHOLAFIN Cholafin view for Intraday 21st Nov #CHOLAFIN
Resistance 1250-1255. Watching above 1257 for upside movement...
Support area 1225-1230 Below 1230 ignoring upside momentum for intraday
Support 1225-1230 Watching below 1223 for downside movement...
Resistance area 1250-1255
Above 1140 ignoring downside move for intraday
Charts for Educational purposes only.
Please follow strict stop loss and risk reward if you follow the level.
Thanks,
V Trade Point

Cholafin view for Intraday 19th Nov #CHOLAFIN Cholafin view for Intraday 19th Nov #CHOLAFIN
Resistance 1250-1255. Watching above 1257 for upside movement...
Support area 1230 Below 1230 ignoring upside momentum for intraday
Support 1225-1230 Watching below 1223 for downside movement...
Resistance area 1250-1255
Above 1250 ignoring downside move for intraday
Charts for Educational purposes only.
Please follow strict stop loss and risk reward if you follow the level.
Thanks,
V Trade Point

Cholafin view for Intraday 11th Nov #CHOLAFIN Cholafin view for Intraday 11th Nov #CHOLAFIN
Resistance 1280-1282. Watching above 1283 for upside movement...
Support area 1240. Below 1260 ignoring upside momentum for intraday
Support 1240.Watching below 1237 for downside movement...
Resistance area 1280-1282
Above 1260 ignoring downside move for intraday
Charts for Educational purposes only.
Please follow strict stop loss and risk reward if you follow the level.
Thanks,
V Trade Point


CHOLAFIN long opportunity We can go long from 1345-1360 .There is strong institutional buying zone.
TRADE OR INVESTMENT AT YOUR OWN RISK.Best opportunity for shot term investment (06 month)
I AM NOT SEBI REGISTERED.

Cholafin for Intraday 24th October #CHOLAFIN Cholafin for Intraday 24th October #CHOLAFIN
Resistance 1415. Watching above 1418 for upside movement...
Support area 1400. Below ignoring upside momentum for intraday
Support 1400.Watching below 1399 for downside movement...
Resistance area 1415
Above ignoring downside move for intraday
Charts for Educational purposes only.
Please follow strict stop loss and risk reward if you follow the level.
Thanks,
V Trade Point

CHOLAFIN Swing Long SetupEnter with Limit order placed at - 1551.90
Target with Risk to reward 1:2 is 1687
Stoploss only when 1 day candle closes below the price - 1462
Note: This is not any financial advice, this is for education purpose only

CHOLAFIN S/R Support and Resistance Levels:
Support Levels: These are price points (green line/shade) where a downward trend may be halted due to a concentration of buying interest. Imagine them as a safety net where buyers step in, preventing further decline.
Resistance Levels: Conversely, resistance levels (red line/shade) are where upward trends might stall due to increased selling interest. They act like a ceiling where sellers come in to push prices down.
Breakouts:
Bullish Breakout: When the price moves above resistance, it often indicates strong buying interest and the potential for a continued uptrend. Traders may view this as a signal to buy or hold.
Bearish Breakout: When the price falls below support, it can signal strong selling interest and the potential for a continued downtrend. Traders might see this as a cue to sell or avoid buying.
20 EMA (Exponential Moving Average):
Above 20 EMA(50 EMA): If the stock price is above the 20 EMA, it suggests a potential uptrend or bullish momentum.
Below 20 EMA: If the stock price is below the 20 EMA, it indicates a potential downtrend or bearish momentum.
Trendline: A trendline is a straight line drawn on a chart to represent the general direction of a data point set.
Uptrend Line: Drawn by connecting the lows in an upward trend. Indicates that the price is moving higher over time. Acts as a support level, where prices tend to bounce upward.
Downtrend Line: Drawn by connecting the highs in a downward trend. Indicates that the price is moving lower over time. It acts as a resistance level, where prices tend to drop.
RSI: RSI readings greater than the 70 level are overbought territory, and RSI readings lower than the 30 level are considered oversold territory.
Combining RSI with Support and Resistance:
Support Level: This is a price level where a stock tends to find buying interest, preventing it from falling further. If RSI is showing an oversold condition (below 30) and the price is near or at a strong support level, it could be a good buy signal.
Resistance Level: This is a price level where a stock tends to find selling interest, preventing it from rising further. If RSI is showing an overbought condition (above 70) and the price is near or at a strong resistance level, it could be a signal to sell or short the asset.
Disclaimer:
I am not a SEBI registered. The information provided here is for learning purposes only and should not be interpreted as financial advice. Consider the broader market context and consult with a qualified financial advisor before making investment decisions.
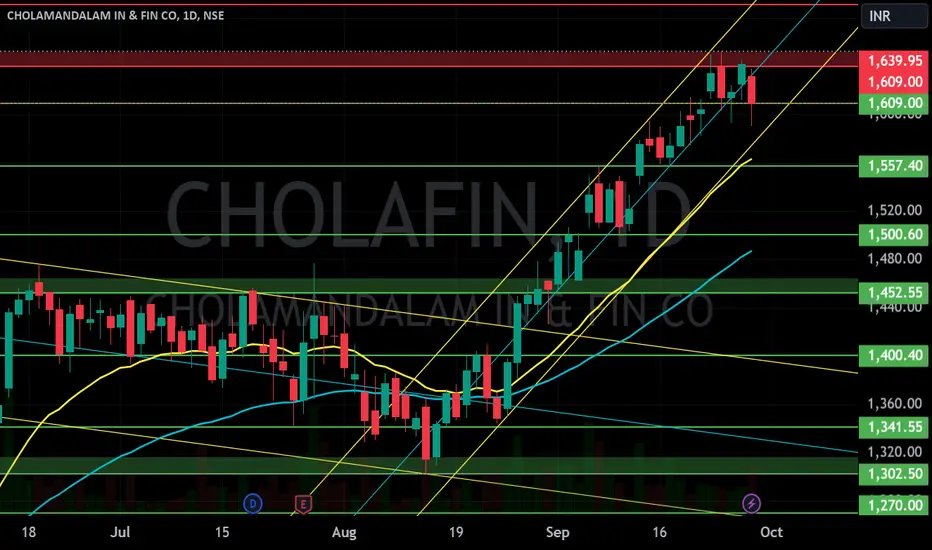
Cholafin view for Intraday 23rd September #CHOLAFIN Cholafin view for Intraday 23rd September #CHOLAFIN
Buying may witness above 1615
Support area 1592-1600. Below ignoring buying momentum for intraday
Selling may witness below 1592
Resistance area 1610-1615
Above ignoring selling momentum for intraday
Charts for Educational purposes only.
Please follow strict stop loss and risk reward if you follow the level.
Thanks,
V Trade Point


Once again ready for going ALL TIME HIGHNSE:CHOLAFIN trade at 1440. Its Support is @ 1300 and Resistence is @ 1480
P/E Ratio - 32. Industry P/E - 18.90
You can watch for next Resistece @ 1800-1900

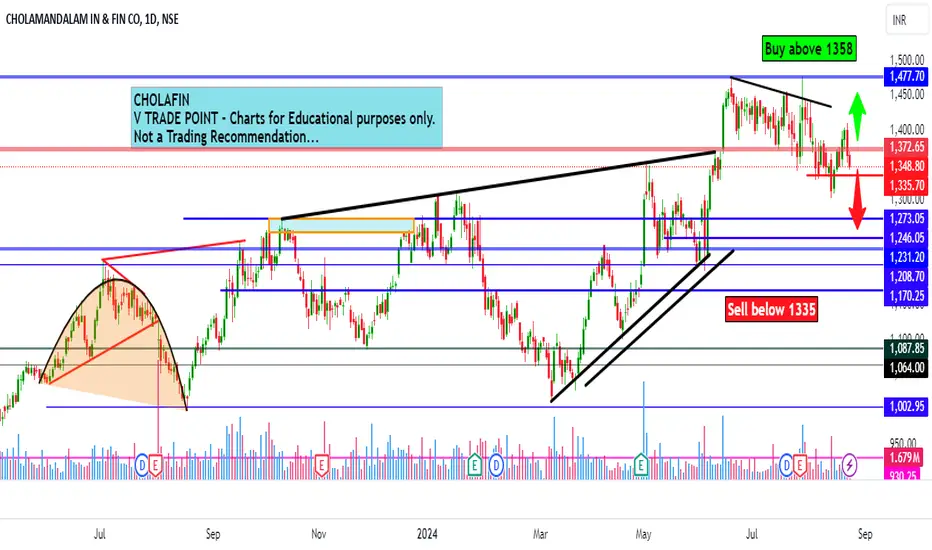
Cholafin intraday level for 26th Aug #CHOLAFIN Cholafin intraday level for 26th Aug #CHOLAFIN
Buying may witness above 1358
Support area 1355. Below ignoring buying momentum for intraday
Selling may witness below 1335
Resistance area 1355-1360
Above ignoring selling momentum for intraday
Charts for Educational purposes only.
Please follow strict stop loss and risk reward if you follow the level.
Thanks,
V Trade Point