Trendline Support Breakdown.Coal India has broken the major support trendline.
Entry: 442-440
Targets: 405-400
Stoploss: 449
COALINDIA trade ideas

Bullish trend in Coal India | Bullish trade ideaThe trend in the daily chart of Coal India is bullish.
The candle today has closed above the resistance.
We may see 500 levels soon.
Educational purpose only

#COALINDIA
Company is almost debt free.
Stock is providing a good dividend yield of 5.11%.
Company has a good return on equity (ROE) track record: 3 Years ROE 51.8%
Company has been maintaining a healthy dividend payout of 51.8%
New Projects 9MFY24
1 Environmental Clearance : EC has been obtained for 14 Proposals (Incremental EC Capacity of 9.85 MTY).
2 Forest Clearance : 1 proposal of wild life clearance (121.58 Ha) has been secured.
3 CIL has approved 5 Coal Mining Projects with a total capacity of 60.04 MTY and incremental capacity of 33.24 MTY.
Solar Power Generation
Aim to set up 3GW capacity of solar power projects to become net-zero by FY 25-26. CIL intends to add another 2 GW of renewable energy, aiming for a total installed capacity
of 5 GW.CIL is also participating in PAN-India Solar tenders of GUVNL, SECI etc to achieve the target of 5 GW. CIL has entered in an MOU with Rajasthan Rajya Vidyut Utpadan Nigam Ltd to develop Solar Power Project at Solar Park in Rajasthan.
Strategic Focus
The company aims to produce 1BT of coal by FY 2025-26.


Coal India (Daily)Coal India Daily chart
Trendline breakout with massive volume
Triangle breakout
Volume spurt
Can target levels in black line
Sl breakout candle low

Coal India NSE:COALINDIA
The structure is quite bullish and could be accumulated for swing trading
target of 10 to 15 % could be kept

COALINDIA BULLISH MOMENTUM BREAKOUTThe stock is trading out its daily range with positive momentum and expected to break and test 494-517 level in future.

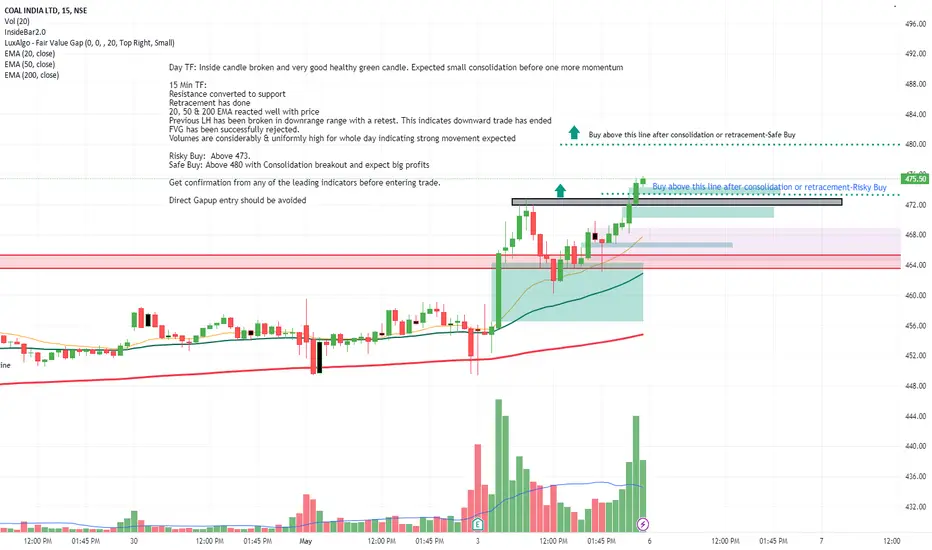
Coal India-Intraday analysis for 06.05.2024-BullishNSE:COALINDIA As per the reference analysis for 29th April for intraday(Coal India), (Attached link for the previous analysis), we couldn’t found any trades since market went into sideways for few days and finally stoploss has hit and good thing is later it has achieved target those who have taken 2nd entry for bullish signs.
Now with this yesterday breakout, stock found some momentum towards bullish side and successfully broken 2nd retest resistance level. One more important points is that resistance converted to support and retracement has also achieved by breaking previous swing highs.
Day TF: Inside candle broken and very good healthy green candle. Expected small consolidation before one more momentum
15 Min TF:
• Resistance converted to support
• Retracement has done
• 20, 50 & 200 EMA reacted well with price
• Previous LH has been broken in downrange range with a retest. This indicates downward trade has ended
• FVG has been successfully rejected.
• Volumes are considerably & uniformly high for whole day indicating strong movement expected
Risky Buy: Above 473.
Safe Buy: Above 480 with Consolidation breakout and expect big profits
Direct Gapup entry should be avoided
Get confirmation from any of the leading indicators before entering trade
Kindy comment below in case of any clarification required on this particular idea.
Please follow for more ideas
Symmetrical triangle on COALINDIACOALINDIA formed a symmetrical triangle on daily chart and broke out of resistance with strong bullishness followed with huge volume spike. Looking the pattern formation, could see bears are weakening on every swing before breakout of resistance. Also note the low volume when price falls indicating sellers are not willing to let go at lower price. Prior runup to formation of the pattern also indicates bulls are out there to move the price. One could have stop loss just below breakout candle with potential target close the width of triangle. Risk reward is also favorable in this trade at 1:2.
Hope you liked this idea, if so please boost this idea so others could benefit or leave a comment on what you think. I'll be glad to hear from you. Otherwise happy trading :-)

lapu Star BreakoutA cup and handle price pattern on a security's price chart is a technical indicator that resembles a cup with a handle, where the cup is in the shape of a "u" and the handle has a slight downward drift.
The cup and handle is considered a bullish signal, with the right-hand side of the pattern typically experiencing lower trading volume. The pattern's formation may be as short as seven weeks or as long as 65 weeks.

lapu star breakoutA cup and handle price pattern on a security's price chart is a technical indicator that resembles a cup with a handle, where the cup is in the shape of a "u" and the handle has a slight downward drift.
The cup and handle is considered a bullish signal, with the right-hand side of the pattern typically experiencing lower trading volume. The pattern's formation may be as short as seven weeks or as long as 65 weeks.

Consolidation in COAL INDIA - Expect a 15% upmove post breakout COAL INDIA - is nearing its 52 week high with decreasing supply on a daily time frame with a consolidation from the past 100 days.
The company has seen an influx of institutional investing. Coal has also been a silent performer and will only increase with the dependency on the product.
Good for swing traders to be kept on watchlist. Look for volume gain above the 30w moving average on weekly time frame.
Can expect an upward momentum of a min of 25%.
Entry - On breakout - INR 455 and above.
SL - swing low of 3%
TSL - According to your risk profile.
Disclaimer: Please be advised that the information provided is not intended as financial advice. It is imperative to conduct thorough research before making any investment or trading decisions.


COAL INDIA rising wedges pattern breakdown coming soon. Coal India has been under a consolidation area for the past 2 trading days. If this stock breaks and sustains below this zone a short trade setup will activate.
It has formed a rising wedges pattern. Breakdown will lead to a short side move.
Entry: 445
Stoploss: 450
Target: 430, 417

Coal India Daily chartCoal India daily chart. Price under time correction in a triangle. Money flowing in the counter. Possible long trade on break and retest of trend line. Consult your financial advisor before taking any trades.

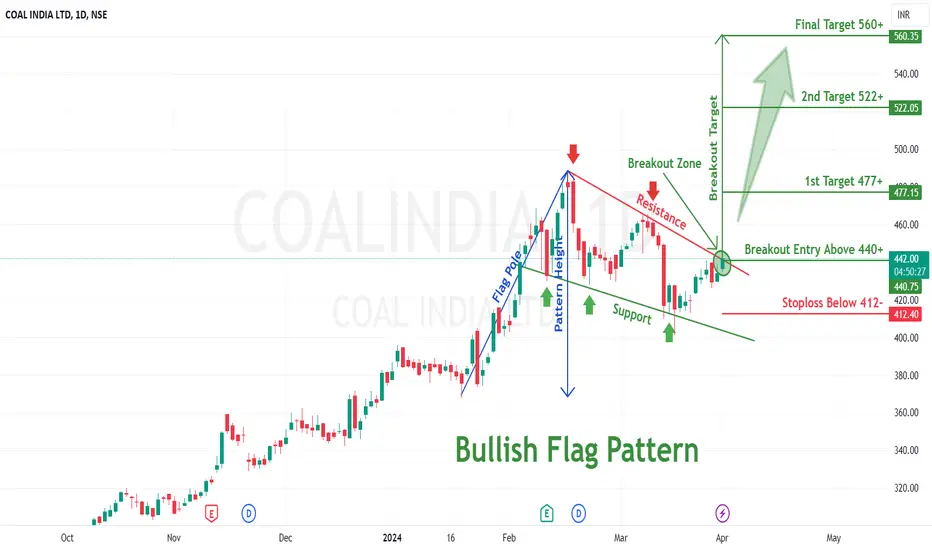
Bullish Flag pattern breakout in COALINDIACOAL INDIA LTD
Key highlights: 💡⚡
✅On 1 Day Time Frame Stock Showing Breakout of Bullish Flag Pattern.
✅Strong Bullish Candlestick Form on this timeframe.
✅It can give movement up to the Breakout target of 560+.
✅Can Go Long in this Stock by placing a stop loss below 412-.
Coal India at its Reversal need to accumulate Target 565Coal India need to accumulate at 415 for the Target of 565 time frame 1 year SL will be 395 good RR

coal india - can got for big fall after a short rise.. Can have short opportunity in coalindia after a small rise. the expected path is shown .. hope to
catch it on time.

COALINDIA--Head & Shoulders??Head and shoulders pattern is identified in this stock.
we have a chance of right shoulder formation.keep safe in this area.
price is now near to Neckline.
on bottom we have a strong support lies at 416 levels,
if price breaks neckline we have a support lies at 416.
keep in long side from support levels,
if neckline failed to push the price downside we have a continuation from this support levels, upside.

Take coal India for 50% UpsideTake entry 460 target 662 , Next average at 298 ,Coal India declared highest Q3 earnings. PSU stocks are already buzzing and it already break its life high also. So it will be ready to fire now.

Coal india Long callBased on the technical analysis of Coal India, the stock seems to be a promising good opportunity. It crossed a significant resistance level, indicating strong upward momentum, particularly notable due to the high or increased trading volume. This suggests good interest and potential bullish sentiment surrounding the stock.
Considering the technicals and the risk-to-reward ratio of 1:7, the trade appears to offer an attractive proposition. With a buy entry point around 460 and a stop loss at 430 for a target price of 630. This setup suggests a potential return of around 35 percent, which is quite Good.
It's crucial to emphasize that this is more of a positional trade rather than a short-term speculation. The call leans towards long-term investment, indicating confidence in the stock's performance over an extended period.

Coal india bullish breakoutCoal India a bullish breakout on the daily timeframe, signaling a potential uptrend. he stock's recent price action suggests a decisive move indicating increased buying interest.

COAL INDIA long setupCoal india, I am bullish and possibly next rejection will be 489 which is 6.14%
Lets wait and see
