COCHINSHIP SWING ANALYSIS ( 25% Upside )COCHINSHIP SWING ANALYSIS ( 25% Upside )
Thanks for stopping by
Regards
PsychoTrader
COCHINSHIP trade ideas

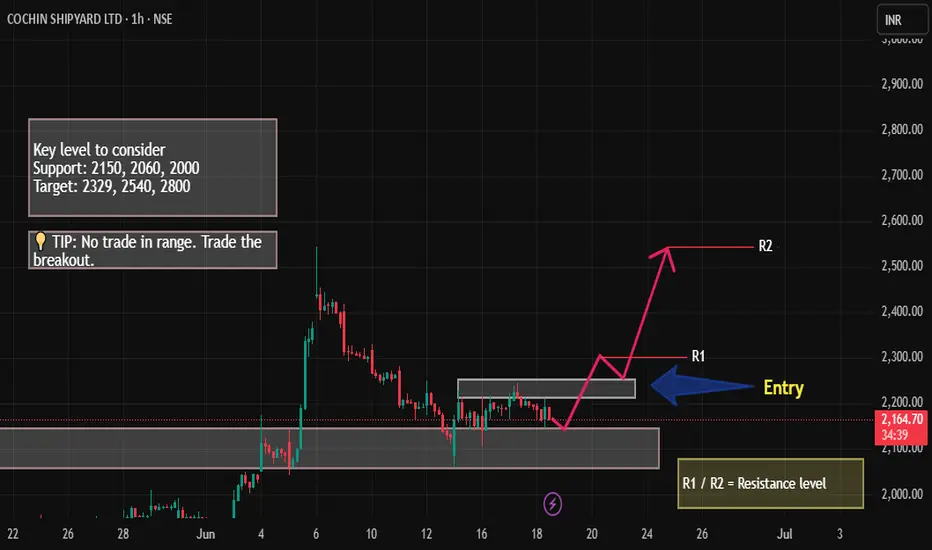
WHATS YOUR VIEWS ON COCHIN ?Hello traders , here is the full multi time frame analysis for this STOCK, let me know in the comment section below if you have any questions , the entry will be taken only if all rules of the strategies will be satisfied. wait for more price action to develop before taking any position. I suggest you keep this pair on your watchlist and see if the rules of your strategy are satisfied.
🧠💡 Share your unique analysis, thoughts, and ideas in the comments section below. I'm excited to hear your perspective on this pair .
💭🔍 Don't hesitate to comment if you have any questions or queries regarding this analysis.
🧠💡 Share your unique analysis, thoughts, and ideas in the comments section below.I'm excited to hear your perspective on this pair .
💭🔍 Don't hesitate to comment if you have any questions or queries regarding this analysis.

Good move is expected soonhi fellas,
The Weekly trend of cochin shipyard is solid and bullish.
At daily timeframe there is a swing whose target can be till the weekly resistance level as mentioned in the chart.
The risk : reward ratio is 1:3.87
Enter after the daily candle closes above 2243.70
SL and target is mentioned in the chart.

Complete trade setup! Kindly follow all key levels and resistance marked on the chart. Be patient — waiting is the key in trading.
#Cochinshipyard - Expecting 30% move from here on Stock is making higher highs
Bullish market structure 💥💥

Cochin Shipyard – Key Level Retracement & Long SetupCochin Shipyard is perfectly retracing to a key support zone, showing strength for a possible bounce.
🔹 Entry: ₹2149
🎯 Target 1: ₹2543
📈 Potential Gain: ~18.3%
🕒 Plan: Holding position unless structure shifts
This setup aligns with the current trend — looking for a continuation after healthy retracement. Tight stop-loss recommended for capital protection.
💬 What's your view on this trade?

COCHINSHIP ANALYSISThanks for stopping by.
All analysis here is done strictly from an investor’s perspective — focusing on risk, return, valuation, and potential upside.
The notes cover key details. I’ve backed every thesis with my own analysis — no fluff, just what matters to investors.
If you find the idea useful or have suggestions, feel free to leave a comment. Always open to fresh insights.
Kind regards,
Psycho Trader

Technical Analysis of Cochin Shipyard LtdTechnical Analysis of Cochin Shipyard Ltd
Disclaimer: This analysis is for informational purposes only and should not be considered financial advice. Always conduct your own research or consult with a financial advisor before making investment decisions. We are not responsible for your loss.
COCHINSHIP Technical Analysis - The chart shows a 1-hour timeframe chart of COCHINSHIP with a focus on potential buying opportunities.
Key Observations:
Upward Trend: The overall trend appears to be bullish, with the price making higher highs and higher lows. The blue ascending trendline reinforces this upward movement.
RSI Divergence: The Relative Strength Index (RSI) indicator shows a bullish divergence. This means that the price is making higher lows while the RSI is making lower lows. This can signal a potential reversal to the upside.
Support and Resistance Levels: The chart highlights several key support and resistance levels. The price is currently trading above the crucial support level of 1,434. If the price can hold above this level, it could continue its upward momentum.
Potential Buying Opportunity: - The chart suggests a potential buying opportunity if the price breaks above the 1,434 resistance level. This could signal a continuation of the uptrend.
Risk Management: - As with any investment, it's crucial to manage risk. Consider using stop-loss orders to limit potential losses if the price moves against your position. Additionally, you might want to set a take-profit target to secure profits once the price reaches a certain level.
Additional Considerations:
Fundamental Analysis: While technical analysis provides insights into price trends, it's essential to consider the company's fundamentals. Factors like earnings reports, management changes, and industry news can also impact the stock price.
Market Sentiment: The overall market sentiment can influence individual stocks. If the broader market is bearish, it could put downward pressure on COCHINSHIP even if the technical analysis suggests an upward trend.
Remember: Technical analysis is just one tool in an investor's toolkit. It's always advisable to combine it with fundamental analysis and consider other factors before making investment decisions.

Cochin Shipyard in Rounding Bottom PatternNSE:COCHINSHIP is in Rounding Botton Pattern following Wave 5. Immediate Target would be 1940. If you are ready to wait then Next Target would be 2200

CochinCochin another defense stock with a bullish structure, poised to make a new high! Positional hold💫

Cochin Shipyard Ready for Blast!Cochin Shipyard remains in a strong bullish uptrend on the daily chart, having recently formed a new higher high before cooling off to its 8DMA. Notably, a key pivot level is also providing support at this zone.
On the lower timeframe, the stock has been consolidating, with a bullish hammer pattern followed by a strong breakout on volume — setting the stage for a potential sharp upmove.
Will the rally sustain in Cochin Shipyard or it is a bull trap?Exactly 6 months before I have shared my bearish view on Cochin Shipyard Ltd you can find in the link below.
Now expecting a sharp decline of up to 60% from current level towards 880 level.
The valuation is concerning and don't just buy because of business media promotions and the recent momentum.
I have plotted the corrective pattern which I see clearly without any alternative view.
Do your own due diligence before taking any action and this insight must not be considered as a trade recommendation.
Peace!!

Cup and handle Pattern - COCHINSHIP
Target and Timeframe:
Target of ₹2400 within a 3 to 6-month timeframe is a reasonable expectation based on the potential of a well-formed Cup and Handle pattern.
Factors Supporting Your Bullish Case:
Potential Breakout: If the price breaks decisively above the handle's resistance with good volume, it could signal the start of the move towards your target.
Sector Dynamics: Consider the overall outlook for the shipbuilding and defense sectors, as positive news or growth in these areas could act as a tailwind for Cochin Shipyard.
Company Fundamentals: While technical analysis focuses on price action, it's always good to have a basic understanding of the company's fundamentals. Positive earnings, order book, or expansion plans could support a bullish move.
Things to Watch For:
Breakout Confirmation: The breakout above the handle's resistance should ideally be accompanied by a significant increase in trading volume. This confirms strong buying interest.
Handle Formation: Ensure the "handle" is a relatively short and shallow downward drift. A handle that is too deep or too long might weaken the bullish signal.
Market Conditions: Overall market sentiment and broader index movements can influence individual stock performance. Be mindful of any significant market downturns that could impact Cochin Shipyard.
Stop-Loss: It's crucial to have a stop-loss level in place below the handle or a recent swing low to manage risk in case the pattern fails to materialize or a false breakout occurs.

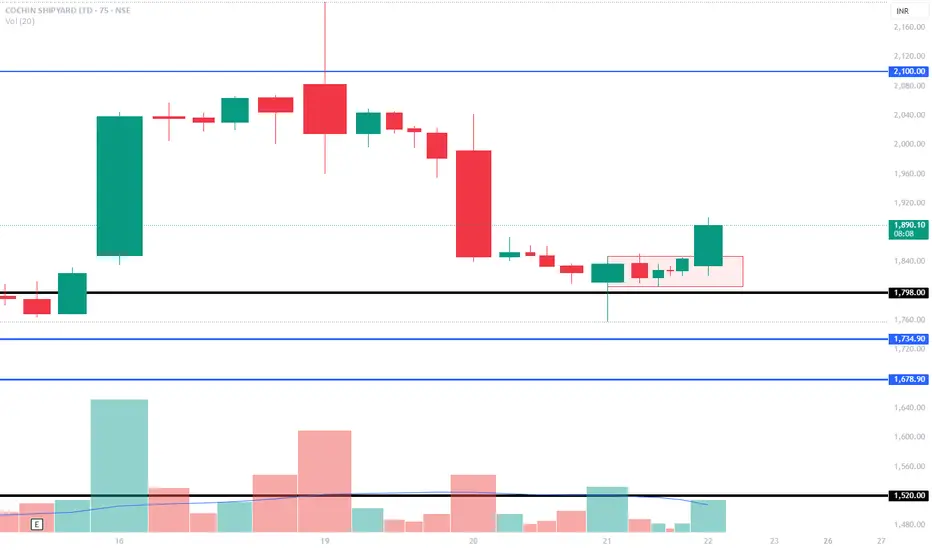
Good for Long and govt investments📊 Chart Overview:
Current Price: ₹1,530.20
Resistance Zone (rejected recently): ₹1,738.60
Support Zones:
Immediate: ₹1,542.35 (now broken intraday)
Stronger: ₹1,196.90
Recent Candle: Strong bearish candle (-3.85%) after touching the resistance
🔍 Technical Analysis:
Failed Breakout:
Price touched ₹1,738 and sharply sold off — bearish rejection at supply.
Today's candle is a strong red bar, implying profit booking or reversal pressure.
Price Zone Reaction:
Now sitting slightly below the ₹1,542 zone which was a previous resistance turned potential support.
If this doesn’t hold, we may see price drift toward ₹1,400–1,300 levels.
Volume Spike:
Recent breakout occurred with high volume, indicating strong interest. But current drop needs watching — is it healthy pullback or reversal?
✅ Trade Strategy
Not a Buy Right Now. Wait for Setup Confirmation.
Instead:
📉 Option 1: If Market Pulls Back Further
Buy near ₹1,450–₹1,480 zone (lower wick support area if it forms)
Stop-Loss: ₹1,395
Target 1: ₹1,542 (retest)
Target 2: ₹1,700–₹1,738
Target 3: ₹2,090 (long-term resistance)
📈 Option 2: If Price Reclaims ₹1,550+ With Strength
Buy on Break and Hold above ₹1,560
Indicates strength returning after dip.
Stop-Loss: ₹1,490
Target 1: ₹1,700
Target 2: ₹1,738
Target 3: ₹2,090
🚫 Avoid if:
Price sustains below ₹1,480 on closing basis.
No bullish candles or volume spike to support rebound.

COCHINSHIP :NSE TRENDLINE BO DTF/WTF POSITIONAL NEW Stock Analysis
Trade Plan:
Entry: 1580 50% of the total quantity at DTF Close, with an additional 50% added at 2130 DTF Close Price.
Stop Loss: 1340
Target 1: 2100
Target 2: 3000
Hold for a period of 6 months to 1 year or until the target 2 is reached.
Chart Pattern:
The stock experienced A BULL RUN FOR 6MONTHS period to touch an all-time high (ATH) of 2999 . A CONSIDERABLE PULL BACK FOR A MONTH AND NOW
Technical Indicators:
The stock’s daily timeframe (DTF) shows that the price is trading TODAY above the 50-day exponential moving average (EMA) and the 50-day EMA above the 200DEMA. The EMAs are in Ascending sequence of alignment. A potential bullish trend in formation on the DTF/WTF timeframe. The 20 DMA has turned upwards starting a bullish reversal and is below the 200DMA indicating an Early Entry
Volume Analysis:
There has been a gradual drying up of volumes on the sell side. There is buying in the past 4 days above the 20VMA. Price Breakout has been done yesterday and retest today take entry as recommended in Trade Plan.
Prioritize Watch List:
Keep this stock in your watch list for further analysis and potential trading opportunities.
Disclaimer: This information is solely for educational and reference purposes. Trading inherently carries risks, and it’s crucial to exercise caution and conduct comprehensive research before making any investment decisions. Make sure you have a well-defined risk appetite, proper position sizing, and a stop-loss order based on your risk tolerance. Review your Portfolio periodically. Exit positions when the price closes 7-8% below your entry point or Earlier basis your Risk profile. Consider re-entering the market when the trend reverses.Before engaging in any trading activities, it is paramount to thoroughly comprehend these technical analysis concepts and conduct extensive research on the stocks you are interested in. Furthermore, consulting a certified financial advisor can offer valuable insights and guidance before making investment decisions.
Technical Analysis Concepts:
Multiple Time Frame Analysis (MTFA):
Daily Time Frame (DTF): Used for short-term analysis and identifying trends.
Weekly Time Frame (WTF): Provides a broader perspective and helps in trend confirmation.
Monthly Time Frame (MTF): Ideal for long-term analysis and trend analysis.
All-Time High (ATH): The highest price reached on a specific chart.
Lifetime High (LTH): The highest price reached over the entire chart’s history.
Stop Loss (SL): A predetermined price level at which an investment is automatically exited to limit potential losses.
Swing Trade: A trading strategy that involves holding positions for a significant period, typically few weeks to months.
Positional Trade: A trading strategy that aims to capitalize on long-term trends and position oneself accordingly.
CHART PATTERNS
Rounding Bottom Cup/Handle (RBC&H): A pattern that signals a potential reversal from a downtrend.
Breakout (BO): A price move closure above a resistance or below a support level.
Flag & Pole BO: (F&P BO) Bullish Continuation Pattern
Consolidation : Price Typically Swings between a Range for a period of Time Long or Short basis the MTFA. Breaking out of this range UPWARDS is an opportunity to BUY and DOWNWARDS is SELL opportunity.
Moving Averages:
Exponential Moving Average (EMA): A popular moving average that places more weight on recent price data.
Volume-Weighted Moving Average (VWMA): A moving average that gives more weight to high-volume stocks.
Fibonacci Retracement/Extension:
Trend-based Fibonacci Retracement: Used to identify potential support and resistance levels during re-tracements.
Trend-based Fibonacci Extension: Used to identify potential breakout levels during extensions.

Long Term - Defence Fundamental PickDefence stocks are currently trading low due to the ongoing tariff trade war. Here are some strong fundamental picks to consider for long-term investment.
📊 Script: COCHINSHIP
⏱️ C.M.P 📑- 1338
🎯 PE 🏆 - 42.78
📊 Script: BDL
⏱️ C.M.P 📑- 1255
🎯 PE 🏆 - 81.3
📊 Script: GRSE
⏱️ C.M.P 📑- 1523
🎯 PE 🏆 - 44.2
📊 Script: PARAS
⏱️ C.M.P 📑- 917
🎯 PE 🏆 - 73.5
📊 Script: MAZDOCK
⏱️ C.M.P 📑- 2317
🎯 PE 🏆 - 34
⚠️ Important: Always maintain your Risk & Reward Ratio.
✅Like and follow to never miss a new idea!✅
Disclaimer: I am not SEBI Registered Advisor. My posts are purely for training and educational purposes.
Eat🍜 Sleep😴 TradingView📈 Repeat 🔁
Happy learning with trading. Cheers!🥂

Cochin shipyard Downtrend channelCochin Shipyard - is in the downtrend channel and nearest support is 1268 and next one 945, Price is below 50, 200 ema not yet crossed. Promoter holding is decreased by ~4.9%. FII's decreased the holding Dec2024.

COCHIN SHIP - PARABOLIC BULLISHNSE:COCHINSHIP Weekly chart showing parabolic formation with location and accumulation may continue further rally till 6000.

Cochin shipyardThe pole and flag pattern is clearly seen on daily chart. Wait for upside or downside movement.

Cochin shipyardThe pole and flag pattern is clearly seen on daily chart. Wait for upside or downside movement.

COCHINSHIP LONGStrong support for COCHINSHIP
1. 200 MA Support
2. Already volume created
3. Weekly fib 61.8%
4. If fails to hold one can buy more at 1250
5. only for Long term
6. Good luck

Jackpot | The begin of impulsehello fellas,
The monthly swing has corrected for about 61%, now at weekly/Daily there is a clear indication of the trend change to buy after the correction.
The impulse of the weekly swing has begun, the market can move to the previous high(2979.45) which is 80% from the CMP.
The risk : reward is 1:3.45

COCHINSHIP BreakoutAll eyes on #COCHINSHIP as it breaks out of a significant resistance level! This breakout signals renewed bullish momentum and could mark the start of an exciting upward trend.
