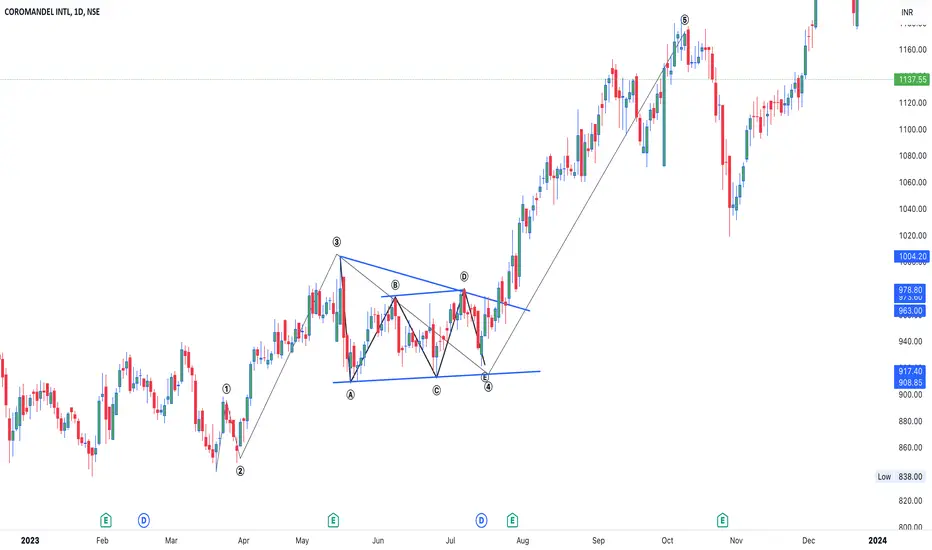
TRIANGLE CORRECTION : ELLIOT WAVE ANALYSIS ( ELLIOTT BABA)TRIANGLE CORRECTION : ELLIOT WAVE ANALYSIS ( ELLIOTT BABA)
A triangle is a sideways movement that is associated with decreasing volume and volatility.
Guidelines
Triangles have 5 sides, Corrective structure labelled as ABCDE
Location :
a- Usually happens in wave B or wave 4
b- Wave D in triangle itself
c- If in second then 2 will be zigzag and this will happen in B of zigzag
d- X wave of Double Three correction and XX wave of Tripple Three
e- XX wave of Double Zigzag correction
f- Wave D in triangle itself
Subdivided into three (3-3-3-3-3)
Subdivision of ABCDE can be either ABC, wxy, or flat
COROMANDEL trade ideas
coromandel
NSE:COROMANDEL
One Can Enter Now ! Or Wait for Retest of the Trendline (BO) Or wait For better R:R ratio
Note :
1.One Can Go long with a Strict SL below the Trendline or Swing Low of Daily Candle.
2. Close, should be good and Clean.
3. R:R ratio should be 1 :2 minimum
4. Plan as per your RISK appetite
Disclaimer : You are responsible for your Profits and loss, Shared for Educational purpose

Can $NSE:COROMANDEL will test 1170 Level ?
As Per OI data and Technical Analysis NSE:COROMANDEL Coromandel International Ltd Looks Bearish if its break 1230-1227 level on closing basis. if its break this level then Probably we can see Potential Downtrend in this stock and it will test 1200,1180,1170 level on chart. and for upside this stock need to break 1265-1270 level,
This message is for informational purposes only and should not be considered financial advice. It is crucial to conduct thorough research or consult with a financial advisor before making any investment decisions. We do not guarantee the accuracy or completeness of the information provided.

COROMANDEL #COROMANDEL looking for longs,
COROMANDEL can touch 1010, 1059, 1094 levels
Stop loss 886
reason for longs: got a Good breakout today, taken support, and time for a channel breakout.

TRADE SETUP_ 10% upside for COROMANDELThis specialty chemical stock is seen in a beautiful Elliot wave structure since the Jan 2023 and has outperformed not only its peers but also major Indian Indices.
The stock recently had a steep and swift decline in October. This very declined was in fact the wave iv of wave 3 and now the stock has kicked off in the Wave v of Wave 3 structure.
It would be wise to wait for a small dip in the stock(towards 1070-1080) to make an entry and ride next wave up towards the 1215 zone.
Note*- Please do own your own research and analysis before taking up any financial positions.

Buying opportunity at CoromandelBuying opportunity at NSE:COROMANDEL
Buy at current market price
Target - 1250
SL - 1120
Profit 7.5%


Long COROMANDELSelf Stock Analysis
One can Long COROMANDEL at CMP with Stop loss 1060 it will show good up side move .
beautiful breakout done .
#stockmarket #stocks #investing #trading #investment #money #finance #forex #invest #nifty #investor #business #sharemarket #financialfreedom #bitcoin #trader #cryptocurrency #entrepreneur #sensex #daytrader #stock #wallstreet #wealth #nse #forextrader #bse #stockmarketindia #daytrading #stockmarketnews #forextrading

Breakout Coromandel int.
Weakly chart breakout creating new life time High
PE ratio lower level best time to taking as a portfolio stock
Coromandel International Ltd is one of India's leading agri solutions provider. It offers a diverse range of products and services across the farming value chain. It specializes in fertilizers, crop protein, bio pesticide, specialty nutrients, organic fertilizers, etc.
Revenue Breakup
The company's business is divided among 2 main segments i.e. nutrient and other allied products (~85% of revenues) and crop protection (~15% of revenues).
Fertilizers Business
The company sells various types of phosphatic fertilizers in the domestic market. It has ~40% share in the unique grade fertilizer sales in India. Overall, it is the 2nd largest phosphatic seller in India and largest single super phosphate (SSP) seller with a market share of ~15%. It has a leading position in the states of Andhra Pradesh and Telangana; India's largest complex-fertiliser markets.
Crop Protection Business
Under this business, the company sells a wide range of crop protection products under its 60+ brands based portfolio. It is 3rd largest manufacturer of mancozeb globally and exports accounts for ~37% of revenues of the business.
Biologicals Business
The company has a rich product pipeline with research on compounds from plant extracts and microbial bio-pesticides. It is a leading manufacturer of azadirachtin in the world with ~65% export share. It exports to USA, Canada and Europe.

breakout of ascending triangleCOROMANDEL has given breakout of Ascending triangle with higher high on daily time frame.
One should consider bullish trade after own analysis.

Harnessing the Power of Bollinger Bands and RSI: A Dynamic DuoTitle: Harnessing the Power of Bollinger Bands and RSI: A Dynamic Duo for Trading Success
Introduction:
When it comes to technical analysis, utilizing multiple indicators can provide traders with a more comprehensive understanding of market dynamics and potential trading opportunities. Two popular indicators, Bollinger Bands and the Relative Strength Index (RSI), offer unique insights into price movements, volatility, and trend reversals. By combining these indicators, traders can enhance their decision-making process and improve their chances of success. In this article, we will explore how to effectively use Bollinger Bands and RSI together to maximize trading outcomes.
Confirmation of Overbought/Oversold Conditions:
One strategy for combining Bollinger Bands and RSI is to confirm overbought or oversold conditions in the market. When the price touches or exceeds the upper Bollinger Band, it may indicate an overbought scenario. Simultaneously, checking the RSI for a reading above the overbought threshold (e.g., 70) provides further confirmation. This combination suggests that the price may have reached an extreme level and a downward correction could be imminent. Conversely, when the price touches or falls below the lower Bollinger Band and the RSI is below the oversold threshold (e.g., 30), it suggests potential oversold conditions. This combination indicates that the price may have reached an extreme low and an upward correction or bounce could be expected.
Confirmation of Price Reversals:
Another way to utilize Bollinger Bands and RSI in tandem is to confirm potential price reversals. In a bullish reversal scenario, traders can look for a price that touches or falls below the lower Bollinger Band, indicating potential oversold conditions. Simultaneously, they should observe the RSI for bullish divergence, where the price forms a lower low but the RSI forms a higher low. This combination suggests a possible trend reversal to the upside, providing an opportunity for traders to enter long positions. Conversely, in a bearish reversal scenario, traders can look for a price that touches or exceeds the upper Bollinger Band, indicating potential overbought conditions. Simultaneously, they should monitor the RSI for bearish divergence, where the price forms a higher high but the RSI forms a lower high. This combination suggests a potential trend reversal to the downside, providing an opportunity to enter short positions.
Confirmation of Breakouts:
The Bollinger Bands can also help traders identify potential breakouts in the market. When the Bollinger Bands contract and squeeze together, it indicates low volatility and often precedes a significant price breakout. To confirm the breakout direction, traders can turn to the RSI. If the RSI crosses above 50, it can provide confirmation of an upward breakout, signaling a potential opportunity to enter long positions. Conversely, if the RSI crosses below 50, it can confirm a downward breakout, suggesting an opportunity to enter short positions. This combined approach helps traders capitalize on breakouts and potentially capture significant price movements.
Trend Confirmation:
Confirming the strength of a trend is crucial for traders. Bollinger Bands and RSI can be used together to validate trend conditions. In an uptrend, the price tends to stay consistently above the middle Bollinger Band (SMA), and the RSI tends to stay above 50. This combination suggests a potential uptrend, and traders can utilize it to validate the strength of the trend and look for opportunities to enter long positions. Conversely, in a downtrend, the price consistently stays below the middle Bollinger Band (SMA), and the RSI remains consistently below 50. This combination indicates a potential downtrend, and traders can use it to confirm the strength of the downtrend and look for opportunities to enter short positions.
Remember, it is essential to consider other factors, such as market conditions, fundamental analysis, and additional technical indicators, before making trading decisions. Using Bollinger Bands and the RSI together can provide valuable insights, but they should be part of a comprehensive trading strategy.

Coromandel International Looks good to after bouncing back from 1/1 support and after being retested the downward trendline.
Positive news- Increased its stake in Dhaksha Unmanned Systems(agricultural Drone makers). Just FYI only.

Cup & Handle formation in Coromandel International.We can see a cup&handle formation in the forming in the stock Coromandel International, a fertilizer company. We could Target 1100 as the target and a Stop loss around 900. Coromandel International is an Indian fertilizer company, the demand for the fertilizer may grow as the monsoon has approached India. The monsoon season is the time when most of the country's agriculture is done. So the demand could give rise in the Coromandel's revenue increasing it's profit.
Disclaimer: The ideas provided by me here are solely my view only and not a financial advice. Use your money properly and manage your risk.

COROMANDEL - Bullish Consolidation with VolumesNSE: COROMANDEL is closing with a bullish consolidation candle supported with volumes.
Today's volumes and candlestick formation indicates strong demand and stock should move to previous swing highs in the coming days.
The stock has been moving along the horizontal support for the past few days which is indicating demand.
One can look for a 8% to 11% gain on deployed capital in this swing trade.
The view is to be discarded in the event of the stock breaking previous swing low.
#NSEindia #Trading #StockMarketindia #Tradingview #SwingTrade
Disclaimer:
This is for educational purposes only.

COROMANDEL TRENDLINE+W PATTERN BREAKOUT👉Trendline Breakout + Closing
👉Volume Buildup
👉W Pattern Neckline Breakout
👉Support @880 & 845
👉Target -- 933/973/1012+

COROMANDEL FORMS NEW HH and HL !!!1Hello to everyone
As we can see on the chart the stock was trading in downtrend and has seen a sharp decline in the price. Stock continuously formed LH and LL , which confirms that price was trading in downtrend as per the Dow Theory , But this time the price has formed a higher low instead of making lower low, which indicates that the downtrend of the price has ended and now the trend reversal can happen in the price and price can go upside in next coming trading sessions. The upper targets of price are 970---1008--1055.
#COROMANDEL 📊
👉Ascending Parallel Channel Breakout
👉Retasted at upper parallel line
👉Price Made First HH and HL
👉Bullish Structure
👉Trend reversal after long decline period
👉Support 880/883
👉Targets --971/1008/1057
Traders, if you liked this idea or if you have your own opinion about it, write in the comments. I will be glad.

Long Term Investment Idea Coromandel International Ltd. Coromandel International limited is a company founded in 1960. Originally named Coromandel Fertilisers, the company is in the business of fertilizers, pesticides and specialty nutrients. CMP of the stock is 934.05. Negatives of the company are High promoter pledge and Declining cash flow from operating activity. Positives of the company are no debt, improving annual net profit, improving quarterly net profit, FIIs and MFs are increasing stake in the company. Entry in the stock can be taken after closing above 941 levels. The targets will be 974 and 1009. Long term target of the stock will be 1044 and 1096. The stock is a long term investment idea. Stop loss should be maintained at closing below 878.

COROMANDEL Buy for intraday tradingCOROMANDEL Buy for intraday trading if stock break the given resistence level..............

COROMANDEL Buy for intraday tradingCOROMANDEL Buy for intraday trading if stock breaks the given resistance level...............


COROMANDEL SHORT TRADE 1 HOURHello TradingView community and my followers, please if you like the ideas, don't forget to support them with likes and comments, thank you very much and here we go.
.
COROMANDEL
1 hour : It has taken the liquidity from major high.
*Wait for the opportunity in lower timeframe (5 min) and we could see downside movement.
THANK YOU !!!!

COROMANDEL buy for intraday tradingCOROMANDEL buy for intraday trading if stock break the given resistence level................

