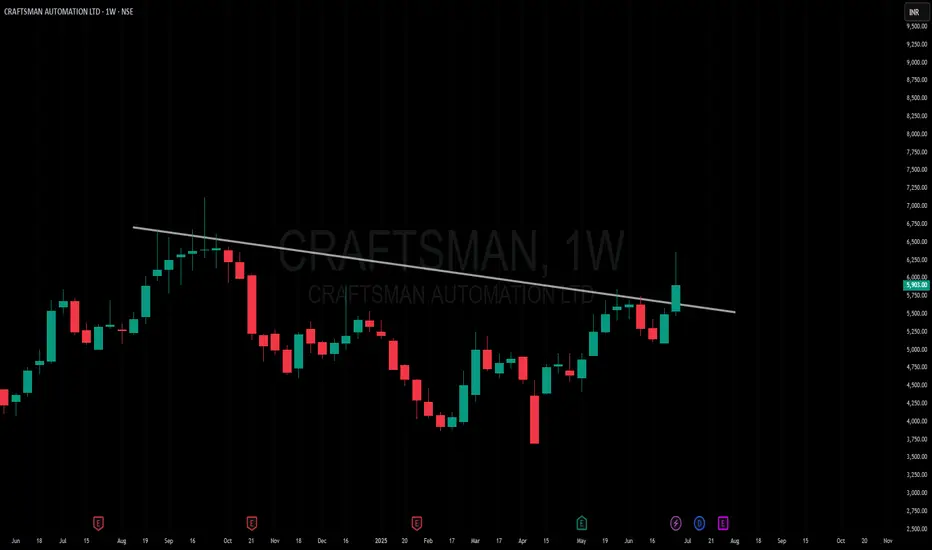
Amazing breakout on WEEKLY Timeframe - CRAFTSMANCheckout an amazing breakout happened in the stock in Weekly timeframe, macroscopically seen in Daily timeframe. Having a great favor that the stock might be bullish expecting a staggering returns of minimum 25% TGT. IMPORTANT BREAKOUT LEVELS ARE ALWAYS RESPECTED!
NOTE for learners: Place the breakout levels as per the chart shared and track it yourself to get amazed!!
#No complicated chart patterns
#No big big indicators
#No Excel sheet or number magics
TRADE IDEA: WAIT FOR THE STOCK TO BREAKOUT IN WEEKLY TIMEFRAME ABOVE THIS LEVEL.
Checkout an amazing breakout happened in the stock in Weekly timeframe.
Breakouts happening in longer timeframe is way more powerful than the breakouts seen in Daily timeframe. You can blindly invest once the weekly candle closes above the breakout line and stay invested forever. Also these stocks breakouts are lifelong predictions, it means technically these breakouts happen giving more returns in the longer runs. Hence, even when the scrip makes a loss of 10% / 20% / 30% / 50%, the stock will regain and turn around. Once they again enter the same breakout level, they will flyyyyyyyyyyyy like a ROCKET if held in the portfolio in the longer run.
Time makes money, GREEDY & EGO will not make money.
Also, magically these breakouts tend to prove that the companies turn around and fundamentally becoming strong. Also the magic happens when more diversification is done in various sectors under various scripts with equal money invested in each N500 scripts.
The real deal is when to purchase and where to purchase the stock. That is where Breakout study comes into play.
Check this stock which has made an all time low and high chances that it makes a "V" shaped recovery.
> Taking support at last years support or breakout level
> High chances that it reverses from this point.
> Volume dried up badly in last few months / days.
> Very high suspicion based analysis and not based on chart patterns / candle patterns deeply.
> VALUABLE STOCK AVAILABLE AT A DISCOUNTED PRICE
> OPPURTUNITY TO ACCUMULATE ADEQUATE QUANTITY
> MARKET AFTER A CORRECTION / PANIC FALL TO MAKE GOOD INVESTMENT
DISCLAIMER : This is just for educational purpose. This type of analysis is equivalent to catching a falling knife. If you are a warrior, you throw all the knives back else you will be sorrow if it hits SL. Make sure to do your analysis well. This type of analysis only suits high risks investor and whose is willing to throw all the knives above irrespective of any sectoral rotation. BE VERY CAUTIOUS AS IT IS EXTREME BOTTOM FISHING.
HOWEVER, THIS IS HOW MULTIBAGGERS ARE CAUGHT !
STOCK IS AT RIGHT PE / RIGHT EVALUATION / MORE ROAD TO GROW / CORRECTED IV / EXCELLENT BOOKS / USING MARKET CRASH AS AN OPPURTUNITY / EPS AT SKY.
LET'S PUMP IN SOME MONEY AND REVOLUTIONIZE THE NATION'S ECONOMY!
CRAFTSMAN trade ideas
Craftsman Automation !📈 Flag and Pole Breakout Alert!
Craftsman Automation looks ready to take off after a prolonged consolidation phase. The stock has broken out on strong volumes, signaling potential for a sharp move upward.
While market volatility remains high, those with a suitable risk appetite may want to keep this on their radar.
🎯 Targets: 6,100 / 6,600
🛑 Stop-loss: 5,225
Note: This is shared purely for educational purposes. Please consult your financial advisor before making any investment decisions.

craftsman automation a good company with good technical chart craftsman automation showing stability after downfall company doing well fundamentally and technical chart also looks good
sector is one of my favorite.
a monopoly sector and can perform good in upcoming time

CRAFTSMANHi,
Price break the resistance area now at the retest zone. resistance become support . its possible chance that price move up side target at marked green zone
previous swing low is Stop loss
This idea is for Educational purpose and paper trading only. Please consult your financial advisor before investing or making any position. Facts or Data given above may be slightly incorrect. We are not SEBI registered.

CRAFTSMAN AUTOMATION LTD S/R Support and Resistance Levels:
Support Levels: These are price points (green line/shade) where a downward trend may be halted due to a concentration of buying interest. Imagine them as a safety net where buyers step in, preventing further decline.
Resistance Levels: Conversely, resistance levels (red line/shade) are where upward trends might stall due to increased selling interest. They act like a ceiling where sellers come in to push prices down.
Breakouts:
Bullish Breakout: When the price moves above resistance, it often indicates strong buying interest and the potential for a continued uptrend. Traders may view this as a signal to buy or hold.
Bearish Breakout: When the price falls below support, it can signal strong selling interest and the potential for a continued downtrend. Traders might see this as a cue to sell or avoid buying.
MA Ribbon (EMA 20, EMA 50, EMA 100, EMA 200) :
Above EMA: If the stock price is above the EMA, it suggests a potential uptrend or bullish momentum.
Below EMA: If the stock price is below the EMA, it indicates a potential downtrend or bearish momentum.
Trendline: A trendline is a straight line drawn on a chart to represent the general direction of a data point set.
Uptrend Line: Drawn by connecting the lows in an upward trend. Indicates that the price is moving higher over time. Acts as a support level, where prices tend to bounce upward.
Downtrend Line: Drawn by connecting the highs in a downward trend. Indicates that the price is moving lower over time. It acts as a resistance level, where prices tend to drop.
Disclaimer:
I am not a SEBI registered. The information provided here is for learning purposes only and should not be interpreted as financial advice. Consider the broader market context and consult with a qualified financial advisor before making investment decisions.


SWING IDEA - CRAFTSMAN AUTOMATIONConsider a potential swing trade opportunity in Craftsman Automation .
Reasons are listed below :
Strong Support at 3700-3800 : The stock has established a solid support level in the range of 3700-3800, formerly a resistance zone, indicating a significant shift in market sentiment.
Bullish Hammer Candlestick : A bullish hammer candlestick observed on the weekly timeframe suggests a potential reversal and uptrend, signaling increased buying interest and bullish momentum.
0.618 Fibonacci Support : Finding support at the 0.618 Fibonacci level strengthens the bullish case, providing a strong foundation for potential upward movement.
Constant Higher Highs : The stock has consistently formed higher highs, reflecting a trend of increasing bullish momentum and reinforcing the potential for further gains.
Double Bottom Pattern : A double bottom pattern has formed on the daily timeframe, indicating a potential trend reversal and adding further confirmation to the bullish outlook.
Target - 5440
Stoploss - weekly close below 3700
Disclaimer :
Decisions to buy, sell, hold or trade in securities, commodities and other investments involve risk and are best made based on the advice of qualified financial professionals. Any trading in securities or other investments involves a risk of substantial losses. The practice of "Day Trading" involves particularly high risks and can cause you to lose substantial sums of money. Before undertaking any trading program, you should consult a qualified financial professional. Please consider carefully whether such trading is suitable for you in light of your financial condition and ability to bear financial risks. Under no circumstances shall we be liable for any loss or damage you or anyone else incurs as a result of any trading or investment activity that you or anyone else engages in based on any information or material you receive through TradingView or our services.
@visionary.growth.insights

Craftsman automation on a break out with high volume Craftsman Automation is a stock that always remains at 52 week high. It had fallen a little since 23rd December and now it has come back on the same path, both ROE and ROCE are above 20. There is a possibility of a break out.

Craftsman on daily break out with high volume Craftsman Automation is a stock that always remains at 52 week high. It had fallen a little since 23rd December and now it has come back on the same path, both ROE and ROCE are above 20. There is a possibility of a break out

Craftsman Automation Ltd 1weekafter break of this channel
i'm expecting a speed move.
.
.
.
.
.
.
.
.
I Am Not SEBI Registered Analyst. All Post and Levels Posting is only for educational and knowledge purpose. I Am not responsible for your any kind of loss or profit.
No Claim, All Rights Reserved.‼️

Craftsman automationGreat business, and looks now correction is almost over. Stock price took support from important Fibo levels, and a long term trend line on daily basis. Also, made a double bottom with clear RSI divergence, daily closing above 4050 will confirm the breakout from double bottom pattern. Immediate targets are 4400 and then 4800. People trading on technical basis can put a stop loss below 3800 on daily closing basis.

MyPOV @ CRAFTSMAN AUTOMATION LTDAs an investor or long-term swing trader, it is important to carefully consider the composition of your portfolio within a 6 to 8 month time horizon. One prudent approach is to patiently await opportune moments at accumulation zones, where the best deals are likely to present themselves. Alternatively, more aggressive traders may choose to enter the market at the current market price (CMP) and strategically add to their positions within that zone.

Craftsman Automation-Nice BreakoutCraftsman Automation-Nice Breakout
Capital to be deployed- 20k
Investing Price -4530-35
Breakout Price -4522
Stoploss -4088
Targets -5088-7045
#craftsmanautomation #StocksToBuy #StocksInFocus #StockMarket #stockstowatch #StocksToTrade

CRAFTSMAN AUTOMATIONInverse head and shoulder breakout and fresh all time high.
stock above all key Moving averages
buy at cmp or on pullback to 3650
stoploss 3320
target 4500

Neat&Clean braakout for uptrend channel for CRAFTSMAN Stockbreakout has seen in CRAFTSMAN stock with huge volume, we can see some upside in short term from this level. overall good stock. this is fundamentally good stock for long term.

Craftsman automation Good for long sl below the trendline
Tgt market rectangle box
Ask your financial advisor before taking any action based on my view
Only for educational purposes

Craftsman near it's 52 week high, possible breakout.2890 is the next resistance. If price sustains above this price, a decent breakout is possible.


CRAFTMAN NSE BULLISHVIEW ABOVE 2700 CMP 2836CRAFTMAN NSE is bullish if 2700 holds. New Lifetime High. Fresh Breakout. Positive Trend.
Disclaimer: Educational Purpose Only. Not Buy Sell Reco . Not Sebi Registered.

Craftsman Automation Ltd Trend AnalysisTo everyone, it looks like reverse H & S pattern but it is not actually.
FIIs & DIIs have increased their holdings in June quarter.
Now everyone is bullish so it will do the opposite.
Technically price is forming medium bearish divergence with RSI on daily TF.
Fundamentally overvalued with high debt to equity and increasing trend of trade payables.
30-33% correction will make it an attractive buy considering future growth potential as company has increased its CAPEX and revenue came back to track after getting hit due to the pandemic.
Expecting a correction till 1760 level.
Good to accumulate around 1700-1800 levels for a strong upside.
Will update the targets after price comes to the accumulation zone.
Stay tuned to my insights regularly so that you will not miss any opportunity to take the desired action right on time.
Do your own due diligence before taking any action.
Peace!!


bullish price actionstock trading above 200 simple moving average after taking support as 1835 levels twice, most importantly it is showing good price action after Q4 results and finally as compares to the recent nifty correction which started in the first week of April the stock has not fallen much since then.

Wait for CRAFTMAN Break upI am waiting after all. On the chart it is creating H&S pattern.
Check my chart!
