DALBHARAT - Will it turn around?DALBHARAT showing reversal trend at 1805 and no longer in downtrend. Price closed above all the downtrend lins and looking for a fresh up move after a year correction.
Theres a possibility it can go to 2050 if 1803 act as support.
DALBHARAT trade ideas

Inverted Head and Shoulder Pattern breakout in DALBHART🔍 Technical Analysis on DALBHARAT (1-Hour Timeframe):
Pattern Formation:
An Inverted Head and Shoulders pattern has recently formed and broken out on the 1-hour chart of DALBHARAT. This bullish reversal pattern is often a strong indicator of a potential upward movement, particularly after the breakout from the neckline.
Breakout and Entry Point:
The breakout occurred as the price crossed above the neckline, which was near the 1795 level. This breakout is a key signal for a potential long entry. Traders can consider going long above 1795, anticipating further upward movement.
Projected Target:
Based on the head height of the pattern, the projected target for this breakout is around 1865+. This target is derived by measuring the distance from the head (the lowest point) to the neckline and adding it to the breakout point. The 1865 level serves as the potential upside target, representing the full price move expected from this pattern.
Stop Loss Consideration:
To manage risk, a small stop loss can be placed at 1751, which is safely below the neckline and the recent low, allowing some room for market fluctuations without prematurely exiting the trade.
Summary:
Entry: Above 1795
Target: 1865+
Stop Loss: 1751
This trade setup aligns with the technical structure of the inverted head and shoulders pattern, offering a favorable risk-to-reward ratio for those looking to capitalize on the potential bullish momentum in DALBHARAT.

Charting with Elliott WavesUnderstanding how to do Technical Analysis of any chart based on Elliott Waves
This analysis is for educational purposes only and should not be considered as trading advice. Multiple scenarios are possible in the real market, and there is a risk of being wrong. It is essential to consult with a financial advisor before making any trading or investment decisions. We are not responsible for any profits or losses incurred based on this analysis.
Wave Rules:
Wave 2 cannot retrace more than 100% of Wave 1.
Wave 3 is never the shortest wave.
Wave 4 should not overlap with Wave 1's price territory, except in diagonal triangles.
Applying Elliott Wave Theory
Elliott Wave Theory is a powerful tool for traders, but it requires practice and a deep understanding of market psychology. By analyzing wave patterns, degrees, and Fibonacci relationships, traders can gain insights into potential market trends and make informed trading decisions. It is important to combine Elliott Wave analysis with other technical indicators and risk management strategies to enhance the accuracy and reliability of market forecasts.
Elliott Wave Theory provides a comprehensive framework for understanding market cycles and predicting price movements. By mastering its principles and applying them with discipline, traders can enhance their ability to navigate the financial markets and capitalize on emerging trends.
Let's understand study of this chart
Current Wave Structure
Primary Wave Count:
- The chart illustrates a completed five-wave impulse sequence (1-2-3-4-5) followed by a corrective phase.
- The primary impulse wave (labeled in red) has completed its cycle, marked by a significant peak at Wave 5.
- The subsequent corrective wave (labeled in blue as (4)) has also completed, indicating a potential beginning of a new impulse sequence.
Subwave Count:
- The internal structure of the primary waves shows clear subwaves, especially within the third wave, which is typically the strongest and longest.
- The chart depicts detailed labeling of smaller degree waves (i-ii-iii-iv-v), ensuring adherence to Elliott Wave principles.
Recent Breakout Analysis
Breakout Confirmation:
- Recently, the price has broken out from a consolidation zone, supported by increased trading volumes. This is a positive sign indicating strong market interest and momentum.
- The breakout occurred after the price retested the previous resistance level, which now acts as a support. This successful retest enhances the credibility of the breakout.
Future Projections
Impulsive Bias:
- Based on the wave structure, the stock appears to be in the early stages of a new impulse wave. This suggests a bullish outlook with potential for significant upward movement.
- The immediate target for this impulse wave is the 1.618 Fibonacci extension level at INR 2,976.60, aligning with typical Elliott Wave projections for Wave 3.
Invalidation Level:
- The nearest invalidation level for this bullish scenario is marked at INR 1,651.40. A break below this level would suggest a re-evaluation of the wave count and the current bullish bias.
Conclusion
The technical analysis of Dalmia Bharat Ltd. indicates a favorable outlook for continued upward movement, supported by a clear Elliott Wave structure and recent breakout confirmation with good volume. However, traders should monitor the invalidation level closely.
I am not Sebi registered analyst. My studies are for educational purpose only.
Please Consult your financial advisor before trading or investing.
I am not responsible for any kinds of your profits and your losses.
Most investors treat trading as a hobby because they have a full-time job doing something else.
However, If you treat trading like a business, it will pay you like a business.
If you treat like a hobby, hobbies don't pay, they cost you...!
Hope this post is helpful to community
Thanks
RK💕
Disclaimer and Risk Warning.
The analysis and discussion provided on in.tradingview.com is intended for educational purposes only and should not be relied upon for trading decisions. RK_Charts is not an investment adviser and the information provided here should not be taken as professional investment advice. Before buying or selling any investments, securities, or precious metals, it is recommended that you conduct your own due diligence. RK_Charts does not share in your profits and will not take responsibility for any losses you may incur. So Please Consult your financial advisor before trading or investing.

DALMIA BHARAT BRAKEOUT ON DAILY CHARTNSE:DALBHARAT
this stock gives brakeout on daily chart.
I am buying this stock
Near 1900-1930
Follow Sl 1750
And my Target is 2100,2300,2450+
Risk reward ratio is 1:3
Return 10-20%

DALBHARAT - FRESH IMPULSE - BULLISH - LONG TERMHi Folks,
Another stock with upcoming bullish momentum. Dalmia Bharat has seen a decent correctoin of more than 50% of the last impulse. After both time and price correction, RSI is cooled off on daily and weekly timeframes.
Recent week showed good accumulation in data with decent volumes. There is a breakout visible from the falling wedge with RSI also breaking out and making newer high.
Elliott wave analysis
1. Larger Wave 1 has an extended internal wave 3.
2. 5 wave structure is visible on the impulse.
3. 2-4 trendline has been violated and the subsequent larger wave 2 unfolded.
4. Correction in wave 2 had nested abc structure which resulted in larger WXY as marked on the chart.
5. Targets of larger wave 3 is marked with fib projections.
6. Invalidation level shall be low of wave 2.
7. Risk: Reward is very decent for long term hold.
Not a buy recommendation. Please do your own due diligence.


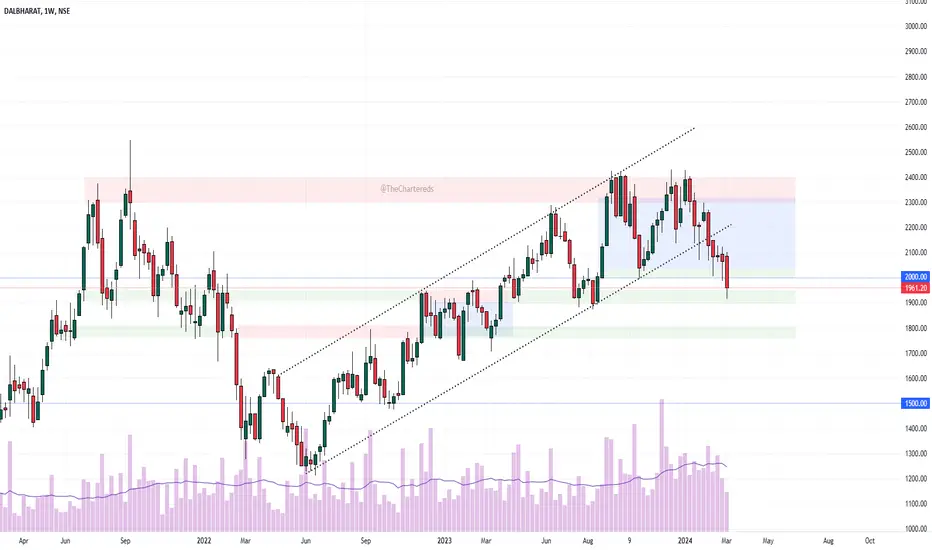
DALBHARAT : Reversal Candidate🎯The chart is pretty self-explanatory as always!
🎯Observe the price action for the next week. A strong weekly close back in the zone (above 2060) will be my green light.
🎯 Of course, Other factors like Volume should be considered.
⚠️Disclaimer: We are not registered advisors. The views expressed here are merely personal opinions. Irrespective of the language used, Nothing mentioned here should be considered as advice or recommendation. Please consult with your financial advisors before making any investment decisions. Like everybody else, we too can be wrong at times ✌🏻
Dalmia Bharat I shared a short trade earlier on Dalmia Bharat which worked perfectly. Here's another scenario which has high probability of playing out.
1. Dalmia Bharat is approaching 1457.15 - 1415.00 area.
a. If It is respected, target is 2550. A new All time high.
b. If 1415 is broken, we will see 1250 level and price from there will make a new all time high.

Dalmia BharatDalmia Bharat. Expect price to go to 2440 and see reversal pattern for short. 2481 is SL from there. If 2480.90 is broken, that's a signal to go up.


dalmiabharat buy
dalmiabharat buy for swing buy near 1830 average at 1800 sl 1750
stoploss 3% tgt3% 5% 7%9%

Dalmia bharat - looks good for investmentsStock is near long term support trend line, more correction will provide even better opportunity to invest. Levels are marked on chart. Fundamentally solid business as well.

Unlocking Opportunity Within Dalmia Bharat's Weekly Triangle PatI am excited to delve into the intriguing scenario currently unfolding in Dalmia Bharat Limited's (DALBHARAT) weekly time frame. The company's shares exhibit a classic triangle pattern, which presents a compelling opportunity for both aggressive and conservative investors alike.
The Setup
Since late December, DALBHARAT has been confined within a symmetrical triangle, characterized by a horizontal resistance line and an ascending support line. The stock has experienced minor fluctuations around the support trendline, suggesting robust buyer confidence. Recently, the price has broken through the support line, signaling a potentially bullish outcome.
DALBHARAT Weekly Triangle
Entry Strategy
For those seeking immediate exposure, a breakout above the triangle's upper boundary, confirmed by increased volume, would suggest a viable entry point. However, for those preferring a more cautious approach, waiting for a definitive breakout beyond the $1,639 mark, the highest peak within the triangle, might prove advantageous.
Stop Loss and Profit Target
To manage risks effectively, a stop loss should be positioned beneath the lowest point of the triangle's base, ensuring minimal losses if the price reverts to the triangle's support line. Conversely, a profit target can be established using the height of the triangle, measured from the breakout point to the nearest extreme of the triangle. Adding or subtracting this measurement from the breakout point yields a reasonable profit objective.
Potential Outcomes
If the breakout proves successful, the stock could experience a rally, which aligns with historical targets suggested by other sources. Alternatively, if the price fails to sustain itself above the triangle's upper boundary, a correction back to the triangle's support line could ensue.
Conclusion
This technical analysis highlights the potential benefits of Dalmia Bharat's weekly triangle pattern. By employing sound risk management principles and adhering to strict entry and exit criteria, investors stand to benefit from the stock's anticipated trajectory. Remember, however, that no technical analysis guarantees outcomes; thus, due diligence remains essential.

Potential Trading Opportunity in DALBHARAT Potential Trading Opportunity in DALBHARAT: Double Bottom Formation at Key Support Levels
DALBHARAT has undergone a healthy correction from its recent peak and is currently trading at a significant confluence of support levels, including its trendline support and the 200-day Simple Moving Average (SMA). This convergence suggests a potential opportunity for the formation of a double bottom pattern on the daily chart, signaling a potential uptrend reversal.
Should the price rebound from this support zone, there is a possibility of a substantial 20% upside movement from current levels. However, failure to sustain above the critical level of 2050 could indicate a lack of buying interest, potentially leading to further downside.
In the scenario of prices breaking below 2050, a downside target range of 1940 - 1875 emerges as a compelling buying opportunity. This zone offers a favorable risk-reward profile, with a relatively low risk of approximately 5% and the potential for significant returns of 30% to 35%.
Investors and traders may consider monitoring DALBHARAT closely for signs of price action around these key levels, as they could provide valuable insights into the short to medium-term trajectory of the stock.

Dalmia Bharat New waveDalmia Bharat may have ended a flat correction or correction may continue later if new lows are coming.
But at this moment looks like a diagonal has ended & can start afresh rally from here.
Can buy Dalmia Cements keeping stop loss of Friday low 2068 for targets of 2500-2600 in next 2-3 months..
Will check new selling or buying signal if stop loss is taken..

DALBHARAT has 55% upside open from CMP...15% in near term.Another day another Cement stock!
The cement sector does not seem to have any shortage of upside potential even in 2024.
Another stock with a good trading setup is DALBHARAT.
The stock is entering into wave III of Wave III of Wave 3(i know it sounds crazy but that's how the extensive sub-division of cement stocks has been)
INR 2260 which happens to be reversal point today intraday for the stock will act as a crucial support for the stock.
INR 2600 could be the very near-term target on the stock while INR 3500 will the target for those who wish to hold this for a bit longer duration.
The Risk-reward from current levels can not really get better.

My view on DALBHARATDALBHARAT
Forming inverse head and shoulder
Should give breakout above 2430
Looking target 2480-2500-2600++
very short term.
Keeping on radar Dalbharat 2500 CE.


DalbharatThisare swing ideas which you can add your watchlist and analysis for yourself !
Keep on your radar!
This content only education purpose!
I am not sebi ragister!


DALBHARATNSE:DALBHARAT
One Can Enter Now !
Or Wait for Retest of the Trendline (BO) !
Or wait For better R:R ratio !
Note :
1.One Can Go long with a Strict SL below the Trendline or Swing Low.
2. R:R ratio should be 1 :2 minimum
3. Plan as per your RISK appetite and Money Management.
Disclaimer : You are responsible for your Profits and loss, Shared for Educational purpose

All time hight • Value in the chart is similar to Mount Everest in series. • Left shoulder start building from July 2021 to September 2021. • Left shoulder High 2300-2370 life time. • Header and shoulder pattern breakout in the dalmiabharth chart. This level, which peaked in July 2021 and acts as resistance, descends to the 1840 level (50 SMA Weakly chart).
Right shoulder encounters resistance between 2280 and 2300, with a downward (100sma) support level of 1860–1870. Header formation from 2300 level to 1200–1220 (200sma) level was accomplished over a two-year period.
Today's stock closed above this level, confirming that the stock has broken out at the 2290-2300 level and that it has sustained all-time high levels.
• This pattern's target is 3300, with a stop loss of 2190 points below this level as the baseline.
No recommendation for buy and sell
Take your own analysis
