Monthly and weekly RSI above 60 Daily RSI taking support on 40.This is my favorite strategy for the. study purpose. Monthly RSI avobe 60 weekly rsi above 60 and daily rsi taking support on 40. So this is the perfect place for the steady purpose.
DIVISLAB trade ideas

DIVISLAB NSE 3Y ATH-RBC BO DTF/WTF/MTF PositionalDIVISLAB Analysis WTF
TRADE PLAN
EARLY ENTRY -5580 WTF On Retest after BO ADD at 5700,5800
SL -5300 WTF
TARGET --01-6400
Hold For a Year or TGT 2
Chart Pattern :
STOCK has recently broken its 3Yr ATH of 5580 forming a RBC on the DTF/WTF. Currently in a consolidation range above the Bo. closing the FVG on WTF 2nd Week Sept.
INDICATORS EMA :
The Price is Currently Trading above 20EMA, and 20EM above 50EMA in DTF. STOCK EMAs are currently aligned in a ascending order 200 to 20 indicating a bullish Trend on DTF/WTF.
FIBO E :
Given the last Impulse and FIBO /E After the Bounce-back from 38% FIBO Retracement Level, Price is currently trading above the 23.6% FIBO Retracement level of on DTF.
Volumes: There is a uptrend in Volume above the 20VMA on the Weekly Charts for2 Weeks
Keep in your Priority Watch List
Disclaimer: For Education/Reference Purpose Only, Trade at your Own Risk with correct position sizing and SL based on your Risk apetite (Exit when price closes 7to8% below your Entry).
Trail Your SL progressively. Learn/Know and Review the Stock trading Technical Terminology. Check Verify the Financial fundamentals of the Stock and Seek Advice from a Certified Financial Advisor prior to Investing. Prefer Entry with 25% quantity, Add in Tranches of 25%-50% as prices moves upwards recommended.
MTFA- Multiple Time Frame Analysis
DTF -Daily Time Frame
WTF-Weekly Time Frame
MTF- Monthly Time Frame
ATH-All Time High
RBC&H-Rounding Bottom Cup/Handle
BO- Breakout Close
EMA -Exponential Moving Average
FIBO R/E -Trend based Fibonacci Retracement/Extension
SL Stop Loss
TBD- To be Decided
CHoCH- Change of Character Bullish/Bearish
MSB/BOS -Break Out Structure
FVG Fair Value Gap
SWING/POSITIONAL Trade

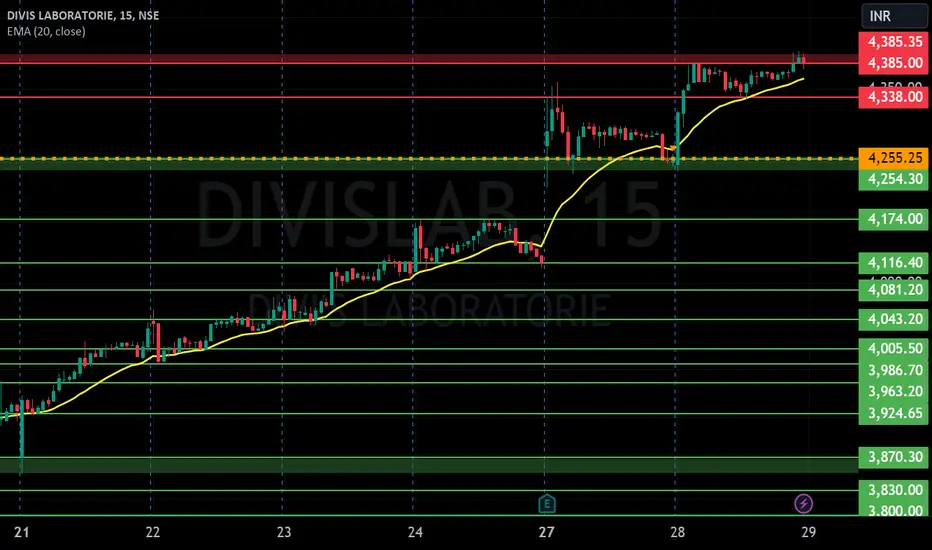
DIVIS LAB S/RSupport and Resistance Levels:
Support Levels: These are price points (green line/shade) where a downward trend may be halted due to a concentration of buying interest. Imagine them as a safety net where buyers step in, preventing further decline.
Resistance Levels: Conversely, resistance levels (red line/shade) are where upward trends might stall due to increased selling interest. They act like a ceiling where sellers come in to push prices down.
Breakouts:
Bullish Breakout: When the price moves above resistance, it often indicates strong buying interest and the potential for a continued uptrend. Traders may view this as a signal to buy or hold.
Bearish Breakout: When the price falls below support, it can signal strong selling interest and the potential for a continued downtrend. Traders might see this as a cue to sell or avoid buying.
20 EMA (Exponential Moving Average):
Above 20 EMA(50 EMA): If the stock price is above the 20 EMA, it suggests a potential uptrend or bullish momentum.
Below 20 EMA: If the stock price is below the 20 EMA, it indicates a potential downtrend or bearish momentum.
Trendline: A trendline is a straight line drawn on a chart to represent the general direction of a data point set.
Uptrend Line: Drawn by connecting the lows in an upward trend. Indicates that the price is moving higher over time. Acts as a support level, where prices tend to bounce upward.
Downtrend Line: Drawn by connecting the highs in a downward trend. Indicates that the price is moving lower over time. It acts as a resistance level, where prices tend to drop.
RSI: RSI readings greater than the 70 level are overbought territory, and RSI readings lower than the 30 level are considered oversold territory.
Combining RSI with Support and Resistance:
Support Level: This is a price level where a stock tends to find buying interest, preventing it from falling further. If RSI is showing an oversold condition (below 30) and the price is near or at a strong support level, it could be a good buy signal.
Resistance Level: This is a price level where a stock tends to find selling interest, preventing it from rising further. If RSI is showing an overbought condition (above 70) and the price is near or at a strong resistance level, it could be a signal to sell or short the asset.
Disclaimer:
I am not a SEBI registered. The information provided here is for learning purposes only and should not be interpreted as financial advice. Consider the broader market context and consult with a qualified financial advisor before making investment decisions.

Divis Labs Set to Soar: Breakout After Month-Long Consolidation.After nearly a month of consolidation, Divis Labs is showing signs of a breakout. With robust fundamentals and a positive market outlook, it’s gearing up for a substantial upward movement (6K on the cards) in the coming weeks. Keep an eye on key support levels and upcoming earnings reports for further validation. Setting up for potential 1:2 RR trade.
Disclaimer: All ideas are my personal views and not financial advise. I do not have any Telegram channel nor do I sell any courses.


DIVISLAB - CUP AND HANDLEClose above 4100 would induce life into the Cup & Handle pattern and let the stock surge.
Has the potential for 25% run up from the current level

DIVISLAE Poised for a Bullish Breakout!
DIVISLAE is on the brink of a bullish breakout above ₹5,135.
Strong potential for upward movement with targets at ₹5,286 and ₹5,424.60.
Ideal opportunity for traders to capitalize on momentum.


Divis labs gives all time high breakout Stock name - Divis labs
Setup - stock gives all time high
breakout in weekly time frame.
Trend - strongly bullish
Buy price - on current price in split form
of your capital
Stop loss - previous week low
Note - please consult your advisor.
before investing in stocks which i
share with you

DIVISLAB 1W TIMEFRAME PROJECTIONDIVISLAB 1W TIMEFRAME PROJECTION
Current Trend is Bullish but as per Elliott wave theory it might have ABC correction which can reject from 1.618 or its extended 1-2-3-4-5 wave Structure.

SWING TRADE COMPLETED ON DIVIS..I shared this chart on 28-may-24 .
my view on this script is bullish ,as i mentioned about entry criteria 2:Breakout and retest 40700 level with good volume .but i got late entry.
Booked 7% on 2nd entry.
#Divislaborotries #Healthcaresector #niftypharma


Divislab on radar above 5100On weekly chart Divislab forming HH and HL 2 years of consolidation
Pharma sector is performing well on bourses
Expect Divis to perform well above 5100
www.tradingview.com

Divis Lab price ActionDivis lab at crucial levels.
After Breakout, it has formed double top and has broken below imp levels.
If breaks below 4600, 4400 is quite possible. below that 4000-3800 visible on chart.

Divis Lab! ready to reverse ??- Gap Filling Done
- Trendline tested 4 times i.e. weakening
- Two Dojis at the gap zone indicating indecision
- A good bullish sign here can mean a potential up move
- Given that the pharma sector hasn't performed in the last year, we may see some momentum in the coming period.
DISCLAIMER: We are not registered. We are not advisors. Everything here is merely for educational purposes and is a purely personal opinion. Please consult your advisor before investing.

DIVISLAB: Multiple Breakouts and Strong Momentum
Breakout on July 26 with high volume
Consolidation phase followed by another breakout
Increased volume during recent breakout
RSI above 70, indicating overbought conditions

DIVI'S LAB : LONG CANDIDATEAs the H&S Breakout has been done in the stock, at present price, pilot position can be initiated. As the stock has extended a bit, better to wait for retracement for full quantity. All other details are explained on th chart. DYOR before taking any position in the stock as I am not SEBI registered analyst.


DIVIS LONGNSE:DIVISLAB Weekly chart forming rounding bottom with positive momentum macd showing short to medium term bullish setups.

DIVISLAB 1WEEKWAIT FOR THE RETEST
ENTER AT 4600
I Am Not SEBI Registered Analyst. All Post and Levels Posting is only for educational and knowledge purpose. I Am not responsible for your any kind of loss or profit.
No Claim, All Rights Reserved.‼️

SWING TUTORIAL - DIVISLABWatch how the stock was on a continuous Lower Low Patter and formed a Lower Low Trendline.
Simultaneously, there was also a formation of Convergence Divergence indicating an upward move.
Stock also broke out of the trendline with a strong green candle.
While the MACD Cross indicated a good entry after the Convergence Divergence, the breakout from the Trendline later indicated a confirmation for a move upward.
Coincidently, the stock also made a new Support zone at 3299 after a strong breakout from trendline.
Another MACD cross has also successfully happened in the last few weeks.
Do you think the stock can reach its All Time High again?
Give your comments in the Comments Section below:

DIVISLAB GIVES BRAKEOUT AFTER A LONG CONSOLIDATIONNSE:DIVISLAB
DIVISLAB gives brakeout after a long consolidation period with brake out in inverted head and shoulder pattern.
Buy rate 3950-4050
SL 3720
Target 5100

DIVIS LAB S/RSupport and Resistance Levels: In technical analysis, support and resistance levels are significant price levels where buying or selling interest tends to be strong. They are identified based on previous price levels where the price has shown a tendency to reverse or find support.
Support levels are represented by the green line and green shade, indicating areas where buying interest may emerge to prevent further price decline.
Resistance levels are represented by the red line and red shade, indicating areas where selling pressure may arise to prevent further price increases. Traders often consider these levels as potential buying or selling opportunities.
Breakouts: Breakouts occur when the price convincingly moves above a resistance level (red shade) or below a support level (green shade). A bullish breakout above resistance suggests the potential for further price increases, while a bearish breakout below support suggests the potential for further price declines. Traders pay attention to these breakout signals as they may indicate the start of a new trend or significant price movement.
Disclosure: I am not SEBI registered. The information provided here is for learning purposes only and should not be interpreted as financial advice. It is important to consult with a qualified financial advisor before making any investment decisions. Tweets neither advice nor endorsement.