Breakout in DivisLabStock Analysis
DivisLab had been stagnant since October 2021 but has recently broken out.
Today's volume indicates significant upside potential.
Trading Strategy
Short-term and Long-term Trading: Both stop loss and target levels for short-term and long-term trades are mentioned on the chart.
Short-term: Follow the specific levels for quick gains.
Long-term: Use the indicated levels to capture extended growth.
This breakout looks promising for both short and long-term trades. Trade with confidence and follow the chart levels!
DIVISLAB trade ideas

DIVIS LAB S/RSupport and Resistance Levels: In technical analysis, support and resistance levels are significant price levels where buying or selling interest tends to be strong. They are identified based on previous price levels where the price has shown a tendency to reverse or find support.
Support levels are represented by the green line and green shade, indicating areas where buying interest may emerge to prevent further price decline.
Resistance levels are represented by the red line and red shade, indicating areas where selling pressure may arise to prevent further price increases. Traders often consider these levels as potential buying or selling opportunities.
Breakouts: Breakouts occur when the price convincingly moves above a resistance level (red shade) or below a support level (green shade). A bullish breakout above resistance suggests the potential for further price increases, while a bearish breakout below support suggests the potential for further price declines. Traders pay attention to these breakout signals as they may indicate the start of a new trend or significant price movement.
Disclosure: I am not SEBI registered. The information provided here is for learning purposes only and should not be interpreted as financial advice. It is important to consult with a qualified financial advisor before making any investment decisions. Tweets neither advice nor endorsement.

DIVIS LAB LONGDivis Lab weekly positive head shoulder exactly at our location with buyers. Macd also shows momentum may be continue to short to medium term.

My view on DivislabDivislab
Forming inverse Head&Shoulder
Looking tgt 3850-3860-3880++
in very short term👆
Keeping on radar Divislab 3900 CE may contract

devis lab--buy on dipcurrently in 1st wave of 3rd wave and is likely to achieve very high targets of 5600( previous high) and above . Stock turned negative on head and shoulder formation and achieved lower trg of 3350 and end of 2nd wave now 1st impulsive going on once correction sets in buy the stock and accumulate.

My view on DivislabDivislab
Trendline breakout possible
Above 3530
Looking target 3600-3640++
Very short term
Keeping on radar Divislab 3500 CE

Divis labDivis lab long term view
Divi's Lab appears to be coiling up! The chart suggests a consolidation phase, where the price is trading within a range. This could be a sign of potential breakout. If the stock breaks above its previous all-time high (ATH), it could trigger a price discovery cycle, where the market searches for a new equilibrium value for the stock. This could lead to significant gains. However, remember, consolidation doesn't guarantee a breakout, so keep an eye on price action

Head & Shoulder breakdown in DIVIS Labs.Divis Lab has broken down from Head & Shoulder pattern and has also retested the support trendline from which it broke down last week.
Entry, Stoploss & Targets are marked on chart.

Divislab trade opportunity Stoploss 3440(1hr candle close below 3440)
Short term long
(sideways upside) target1&2 3540,3560

Investment Opportunity Analysis: DIVISLAB
Introduction:
DIVIS LAB, a prominent player in the pharmaceutical sector, has recently experienced a correction of 15% from its recent peak. This correction aligns with the formation of an ABC pattern within the Elliott Wave structure, indicating potential buying opportunities. Furthermore, the stock is currently trading within an extended demand zone following a liquidity sweep of the last swing low. This analysis aims to explore a buying opportunity in DIVIS LAB, considering its strengths, weaknesses, and limitations.
Strengths:
1. Consistent Revenue and Profit Growth: Over the past five years, DIVIS LAB has demonstrated robust revenue and profit growth, with a Compound Annual Growth Rate (CAGR) of 22.9% and 35.5%, respectively. This consistent growth trajectory underscores the company's operational strength and market positioning.
2. Healthy Profitability Ratios: DIVIS LAB maintains commendable profitability ratios, including a Return on Equity (ROE) of 22.17% and a Return on Capital Employed (ROCE) of 28.68% over the past three years. These figures highlight the company's efficient utilization of capital and ability to generate returns for its shareholders.
3. Strong Financial Position: With minimal debt and a robust interest coverage ratio of 1,393.96, DIVIS LAB enjoys a strong financial footing. The absence of significant debt obligations enhances the company's resilience and provides flexibility for future investments and expansion.
4. High Operating Margins: DIVIS LAB has consistently achieved impressive operating margins, averaging at 37.36% over the last five years. This indicates effective cost management practices and pricing strategies, contributing to sustained profitability.
5. Strong Liquidity and Promoter Confidence: With a current ratio of 6.40 and a promoter holding of 51.92%, DIVIS LAB exhibits strong liquidity and promoter confidence. The high promoter holding reflects a positive outlook on the company's prospects, instilling investor confidence.
Weaknesses:
1. Recent Slower Growth: Despite its historical growth trajectory, DIVIS LAB has experienced a slowdown in revenue and profit growth over the past three years. This deceleration may raise concerns among investors regarding the company's future growth potential and market competitiveness.
2. High Valuation: DIVIS LAB currently trades at a relatively high Price-to-Earnings (P/E) ratio of 67.51, suggesting a potential overvaluation. Investors should exercise caution and assess the stock's valuation in relation to its growth prospects before making investment decisions.
Limitations:
1. Disclaimer: This analysis is based on publicly available information and should not be construed as financial advice. Investors are urged to conduct thorough research and due diligence before making investment decisions.
Conclusion:
Despite facing challenges such as slower growth and high valuation, DIVIS LAB presents a compelling investment opportunity, considering its strong financial position, consistent profitability, and favorable technical indicators. Investors should carefully weigh the risks and opportunities associated with investing in DIVIS LAB and consider consulting with financial professionals before proceeding.

devis lab--buyonce crosses 3565 , 10 days moving average will show bounce from neckline and will be bullish once crosses 20 days moving average3634 will be bullish for stock. buy with a small stop loss and trail it . 200 DMA 3653 for more strenght and trend to become bullish .MACD hourly showing bottoming out .

My view on DIVISLABDivislab
Forming Head & Shoulder pattern
Looking weak for tgt 3400-3380-3360++
Keeping on radar Divislab 3500 PE (march)

DIVISLAB--Head & Shoulders pattern??Head and shoulders pattern is identified in this stock.
price is now near to Neckline.
on bottom we have a strong support lies at 3400 levels,
if price breaks neckline we have a support lies at 3400.
keep in long side from support levels,
if neckline failed to push the price downside we have a continuation from this support levels.

$divislabnice spot to hop on
assuming divis lab is healthcare so should keep going
you buy a 200 retest on the weekly for a chart like this always ..
flip side cut it as quick as u can if it goes below
best risk /reward imho

DIVIS LAB AT TRENDLINEIt seems good to buy because it's taken support from the Weekly trendline yet again.
.
I am not a SEBI Registered Analyst. Anything posted here is my own analysis and views. This is created for educational purposes only. Always consult your Financial Advisor before taking any decision or trade.

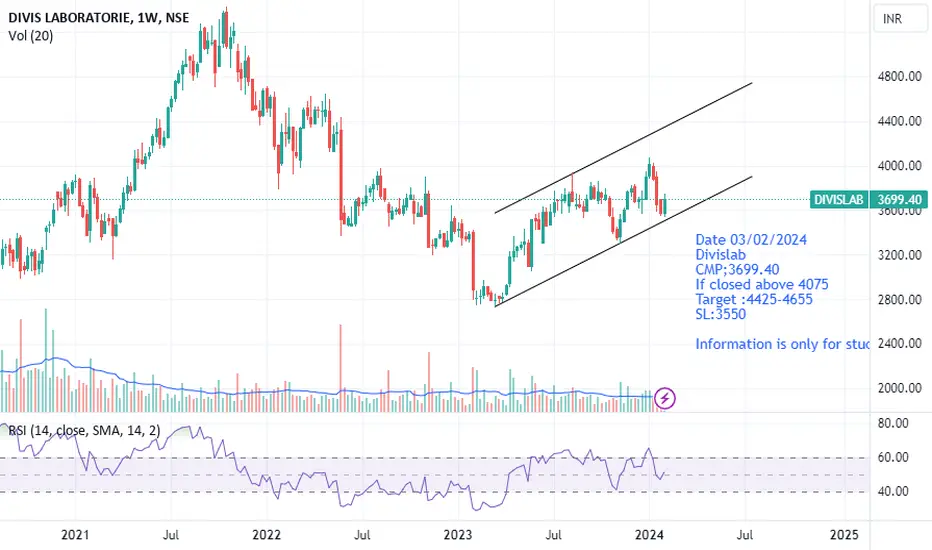
Divis labDate 03/02/2024
Divis lab
CMP;3699.40
If closed above 4075
Target :4425-4655
SL:3550
Information is only for study purpose
FOR SWING DIVILAB LTD
looking for buy opportunity for 1-2months
strong base- 3560-3535
buying range-CMP
target - 1st3920---3940--3950+🚀🚀
stop loss-3530❌❌
ABOUT
Incorporated in 1990, Divis Laboratories Ltd manufactures and exports API's, Intermediates and Nutraceutical ingredients
Company manufactures Generic Active pharmaceuticals ingredients, Custom synthesis of APIs & Intermediates along with Nutraceuticals for Global Pharmaceutical & Nutraceutical industry
Disclaimer:
I am not a SEBI Registered Analyst.
Anything posted here is my own analysis and views. This is created for educational purposes only. Always consult your Financial Advisor before taking any
decision or trade.
Happy trading.

Possible head and shoulder breakout (Education purpose only)Its seems like stock has given major breakout on daily time frame. Possible head and shoulder breakout (Education purpose only).
Target could be 4700, 4800 then will update later.
Stoploss 3800

DIVISLAB DAILY CHARTDIVISLAB DAILY CHART
Breakout @ 3835 Target MOB @ 4270-4330 Support @ 3550
This stock has witnessed an ellipse breakout @ 3835 levels, with target MOB active @ 4270-4330.
This is only an observation & not any suggestion or recommendation.

DIVISLAB Weekly Timeframe Analysis for long term
NSE:DIVISLAB about to breakout 3760 level.
We can see long term move above 3760 with SL of 3420 and can average till 3587.
Major targets levels are highlighted in blue lines.

divis lab breaks out symmetrical triangle divis lab breaks out symmetrical triangle 3850 resistance zone with the help of support 3770 we can see 4295

DIVISLABGood Head and shoulders breakout..tgt measured and posted..Pharma will move up..As people will look for stocks which have not moved up..and also into defensives

Divis Looks good on chart (3915)Divis Looks good on chart (3915), study the chart.
Please consult with your financial advisor before taking any trade.
