DIVISLAB trade ideas

divis lab break away gap filleddivis lab trying to catch falling knife
cmp 2819
sl 2740
target 2977
2 days candle of 8 feb and 7 feb combine e form a doji...means a blend of candle stick
doji near support indicate a reversal
rsi oversold
pharma index strong
position sizing in check
longterm wealth generation takes time
being a trader means disciplined and patient


DIVIS LAB (D)-Trendline Breakout and Retest
- Forming H & S pattern
- Good Volume buildup from past few days
- 2800-3000 Strong Support area
- Can be a long term pick, What do you think?????

BULLISH FALLING WEDGES IN DIVI'S LABORATORIE Hello trader,
You can see in 1day chart of divi's laboratories there first it makes bullish falling wedge and after that gave breakout
You can buy here for short term or swing trading and you can keep 3% stoplossand target near 50% upside movements


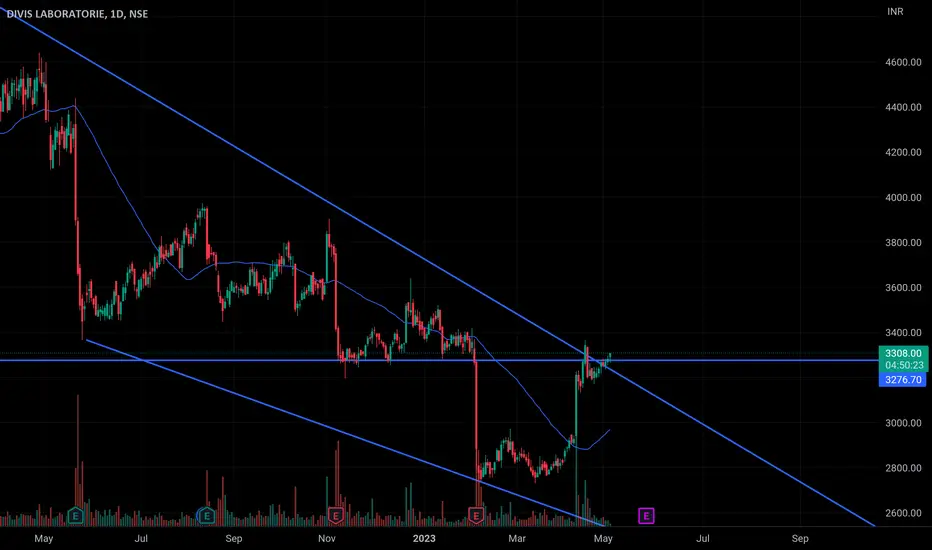
Bullish on DIVISI am positive on divi's lab as it broke trendline resistance which is restricting it from last May. Now it broke out trendline resistance and sustained above important moving average levels. Ofcourse there were some resistance in its path, but present conditions shows Nuetral to bullishness sentiment on this stock.
Import resistance level to look out for is 3682
Important support to look out for 3193 - 3054 range.

Divis LabsLong term Trend line BO
Above 50 and 200 Monthly SMA
Once it cross 20 SMA, it is considered as a reversal.
Resistance and supports are marked in the charts

DIVISLAB Make falling wedge chart pattern in 4 hour time fram , 50 EMA cross 100 EMA from below also take support of 50 EMA , MACD saw fair value , take breakout with high volume at resistance level and do retest at resistance so first Target will be 3897.20 and stop loss will be 3035.65 .
This is for educational purpose not a trading advice so that's my view comment down your view.

DIVISLAB--Bullish view@ 3000 ??9bservations::
The stock is trending upwards.
currently this stock is trending bearish ,In lower timeframes.
price facing resistance again from previous Resistance@ 3400 and showing bearish pressure caused the price pushing downwards.
in the middle price leaves a supply zone 3280 level causing the price to push back, keep on buyside after breaking this levels. if you miss entry @ bottom levels.
previous while breaking the resistance price creates a demand zone in the range 2950-3000. Buyside--Targets are 3400 and 3500 3600 .
if price come back to this zone Resistance, we will look for sell until 3300 levels only.
Keep track tis level for buy side, if price breaks the demand zone we have strong support lies in the range 2800-2750. Look at these levels.
NSE:DIVISLAB

Divis Laboratories LtdIncorporated in 1990, Divis Laboratories Ltd manufactures and exports API's, Intermediates and Nutraceutical ingredients
GAVE A RUN UP FROM 2720 TO 3450 - RSI Exhaustion observed.
Short 3445 - 3550 levels with 3575 SL
Target - 3150
Market Cap
₹ 90,923 Cr.
Current Price
₹ 3,425
Stock P/E
37.9
Book Value
₹ 457
Dividend Yield
0.89 %
ROCE
35.1 %
ROE
28.2 %
Face Value
₹ 2.00
Promoter holding
51.9 %
EPS last year
₹ 112
EPS latest quarter
₹ 11.6
Debt
₹ 3.29 Cr.
Pledged percentage
0.00 %
Net CF
₹ -816 Cr.
Price to Cash Flow
47.6
Free Cash Flow
₹ 1,199 Cr.
Debt to equity
0.00
OPM last year
43.4 %
OPM 5Year
38.9 %
Reserves
₹ 12,082 Cr.
Price to book value
7.47
Int Coverage
5,840
PEG Ratio
1.66


D i v i s lab bullish breakout.Divis lab has given bullish break out on daily chart.
There is a Breakout of cup and handle pattern on daily chart,so we are expecting a move in upper direction.


Divis - W- rally halted at resistance. Downtrend can resumeDivis bounce has halted precisely at marked reistance
Last qtr post results saw a sharp dip. Sell with SL on Close above 3380

Divislab Chart Pattern Divislab looks very bullish based on chart pattern analysis and periodic wave analysis.

Chart Look good to LongDivis lab can be long from here with SL 2700 and target 5000
1. Chart makes the double bottom and taken support the long unfilled gap.
2. Volume is also good.
3. Fundamental also looks good.
4. Nifty Pharma is also performing well.

BULLISH CROSSOVER (P)NSE:DIVISLAB
Recently, the smaller SMA has crossed above the larger SMA.
The resistance is yet to be broken.
R:R = 1:2

DIVISLAB FORMED DOUBLE BOTTOM ON DTFThe Price trading near strong and crucial support level of 2730. Price formed Double Bottom chart pattern near the support level. If price holds this level that we can look for short term upside.
If price breaks down the support level of 2350 than more fall can be see in next coming trading sessions.

DIVISLAB - Weekly AnalysisIn the Weekly Chart of DIVISLAB ,
we can see that, it is showing recovery in W Pattern.
Lets see will it sustain or fail.
It is sustains we can see big targets .

Big decision point for Divis labI would like to watch which side it breaks out, from there I would like to take a call. I will try to stay neutral at this point.
