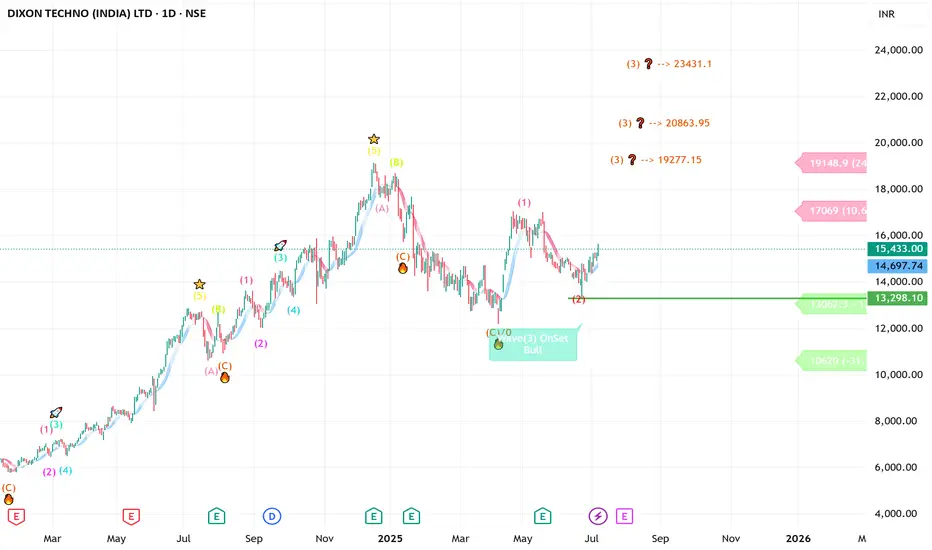
DIXON -----Daily counts Fresh Implus start anytime -UpsideDIXON -----Daily counts indicate Excellent bullish wave structure.
Both appear to be optimistic and this stock invalidation number wave 2 low
target short / long term are already shared as per charts
correction wave leg seems completed
Investing in declines is a smart move for short/ long-term
Next report date
—
Report period
—
EPS estimate
—
Revenue estimate
—
208.40 INR
10.96 B INR
388.60 B INR
34.31 M
About DIXON TECHNO (INDIA) LTD
Sector
Industry
CEO
Atul Behari Lall
Website
Headquarters
Noida
Founded
1993
ISIN
INE935N01020
FIGI
BBG00DY9XKQ5
Dixon Technologies (India) Ltd. engages in the manufacture and sale of electronic products. The firm offers consumer electronics such as LED television, home appliances such as washing machines and lighting products such as LED bulbs and tube lights, down lighters, and compact fluorescent bulbs and mobile phones. It also provides after sales services. The company was founded by Sunil Vachani and Atul Bihari Lall on January 15, 1993 and is headquartered in Noida, India.
Related stocks
#DIXON - 4000 Pts move coming? 18246 or 9842.00?Date: 24-05-2025
#Dixon
Current Price: 14473
Pivot Point: 14044.00 Support: 13213.60 Resistance: 14882.04
Upside Targets:
Target 1: 15991.02
Target 2: 17100.00
Target 3: 18246.00
Target 4: 19392.00
Downside Targets:
Target 1: 12100.80
Target

DIXON techno-funda analysisDixon Technologies is one of India’s largest electronics manufacturing services (EMS) companies, operating across mobile phones, TVs, lighting, wearables, and security systems. With significant capacity, backward integration, and multiple PLI-linked verticals, it serves global brands under a B2B mod

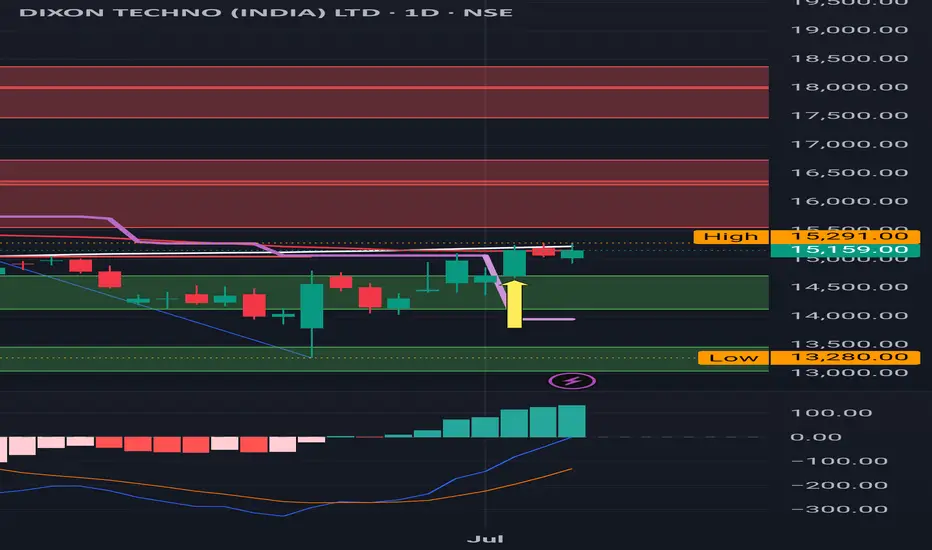
Dixon: Buy triggered, be mindful of a Red Band resistance Dixon: Buy triggered, be mindful of a Red Band resistance .
( Not a Buy / Sell Recommendation
Do your own due diligence ,Market is subject to risks, This is my own view and for learning only .)
DIXON Technologies – Bearish Analysis📉 DIXON Technologies – Bearish Analysis
Timeframe: 15-minute
Trend: Clearly downward with consistent Lower Highs and Lower Lows
Indicators:
EMA Ribbon :
Price is currently below all EMAs, which are fanned out and sloping down — confirming strong bearish momentum.
EMA ribbon is acting as a dynamic r

DIXON : After a Sell Signal , downward trend continues
DIXON : Sell Signal.
Downward trend continues from 17025.
Turned into a Sell Signal.
It's under 200 SMA now
MACD also is negative .
Major Support is @ 12000+
( Not a Buy / Sell Recommendation
Do your own due diligence ,Market is subject to risks, This is my own view and for learning only .

DIXON WILL FALL TILL 12800 for short termDixon Tech is in downtrend for long term trend and it will fall till 12800 in short term , so watch it, and then observe price action,

Nalco - Harmonic Pattern Analysis and outlookNATIONAL ALUMINIUM CO LTD: CMP- 183.84;
📉 Suggested Pattern:
- BAT harmonic pattern completion.
📊 Recent Price Action:
- Shares of National Aluminium Company Limited closed below the previous closing price.
- Formation of a Lower Low, reinforcing bearish sentiment.
📈 Forecast:
- Potential Do

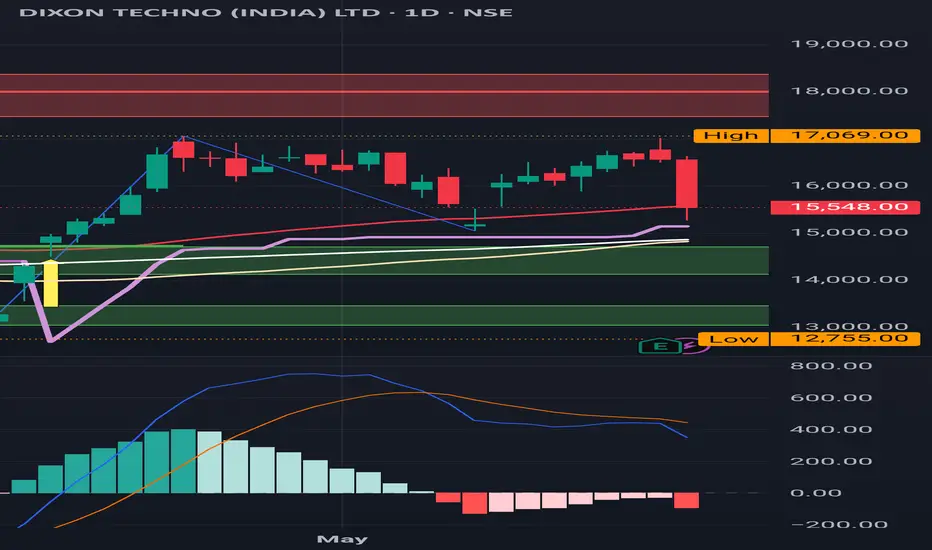
Dixon : Couldn't clear the resistance of 17069 .
Dixon : Couldn't clear the resistance of 17069 this time as well.
Another Major resistances in the form of Red
Bands are clearly displayed on the chart at around 18000+ level .
( Not a Buy / Sell Recommendation
Do your own due diligence ,Market is subject to risks, This is my own view and f
Dixon Technologies | Head & Shoulders Breakdown | Bearish Target📝 Analysis:
Dixon Technologies (NSE: DIXON) is forming a classic Head and Shoulders pattern, signaling a potential trend reversal from bullish to bearish.
The pattern structure is clear:
Left Shoulder: Formed after a rally and minor correction.
Head: Made a higher high but failed to sustain.
Righ

See all ideas
Summarizing what the indicators are suggesting.
Neutral
SellBuy
Strong sellStrong buy
Strong sellSellNeutralBuyStrong buy
Neutral
SellBuy
Strong sellStrong buy
Strong sellSellNeutralBuyStrong buy
Neutral
SellBuy
Strong sellStrong buy
Strong sellSellNeutralBuyStrong buy
An aggregate view of professional's ratings.
Neutral
SellBuy
Strong sellStrong buy
Strong sellSellNeutralBuyStrong buy
Neutral
SellBuy
Strong sellStrong buy
Strong sellSellNeutralBuyStrong buy
Neutral
SellBuy
Strong sellStrong buy
Strong sellSellNeutralBuyStrong buy
Displays a symbol's price movements over previous years to identify recurring trends.
Frequently Asked Questions
The current price of DIXON is 16,698.05 INR — it has decreased by −0.42% in the past 24 hours. Watch DIXON TECHNOLOGIES (INDIA) LIM stock price performance more closely on the chart.
Depending on the exchange, the stock ticker may vary. For instance, on BSE exchange DIXON TECHNOLOGIES (INDIA) LIM stocks are traded under the ticker DIXON.
DIXON stock has risen by 3.18% compared to the previous week, the month change is a 15.11% rise, over the last year DIXON TECHNOLOGIES (INDIA) LIM has showed a 53.36% increase.
We've gathered analysts' opinions on DIXON TECHNOLOGIES (INDIA) LIM future price: according to them, DIXON price has a max estimate of 22,100.00 INR and a min estimate of 9,085.00 INR. Watch DIXON chart and read a more detailed DIXON TECHNOLOGIES (INDIA) LIM stock forecast: see what analysts think of DIXON TECHNOLOGIES (INDIA) LIM and suggest that you do with its stocks.
DIXON reached its all-time high on Dec 17, 2024 with the price of 19,149.80 INR, and its all-time low was 366.20 INR and was reached on Aug 8, 2019. View more price dynamics on DIXON chart.
See other stocks reaching their highest and lowest prices.
See other stocks reaching their highest and lowest prices.
DIXON stock is 1.41% volatile and has beta coefficient of 1.44. Track DIXON TECHNOLOGIES (INDIA) LIM stock price on the chart and check out the list of the most volatile stocks — is DIXON TECHNOLOGIES (INDIA) LIM there?
Today DIXON TECHNOLOGIES (INDIA) LIM has the market capitalization of 1.01 T, it has increased by 1.58% over the last week.
Yes, you can track DIXON TECHNOLOGIES (INDIA) LIM financials in yearly and quarterly reports right on TradingView.
DIXON TECHNOLOGIES (INDIA) LIM is going to release the next earnings report on Oct 23, 2025. Keep track of upcoming events with our Earnings Calendar.
DIXON earnings for the last quarter are 46.30 INR per share, whereas the estimation was 35.04 INR resulting in a 32.15% surprise. The estimated earnings for the next quarter are 45.15 INR per share. See more details about DIXON TECHNOLOGIES (INDIA) LIM earnings.
DIXON TECHNOLOGIES (INDIA) LIM revenue for the last quarter amounts to 128.37 B INR, despite the estimated figure of 120.38 B INR. In the next quarter, revenue is expected to reach 151.02 B INR.
DIXON net income for the last quarter is 2.25 B INR, while the quarter before that showed 4.01 B INR of net income which accounts for −43.87% change. Track more DIXON TECHNOLOGIES (INDIA) LIM financial stats to get the full picture.
Yes, DIXON dividends are paid annually. The last dividend per share was 5.00 INR. As of today, Dividend Yield (TTM)% is 0.03%. Tracking DIXON TECHNOLOGIES (INDIA) LIM dividends might help you take more informed decisions.
EBITDA measures a company's operating performance, its growth signifies an improvement in the efficiency of a company. DIXON TECHNOLOGIES (INDIA) LIM EBITDA is 17.42 B INR, and current EBITDA margin is 3.88%. See more stats in DIXON TECHNOLOGIES (INDIA) LIM financial statements.
Like other stocks, DIXON shares are traded on stock exchanges, e.g. Nasdaq, Nyse, Euronext, and the easiest way to buy them is through an online stock broker. To do this, you need to open an account and follow a broker's procedures, then start trading. You can trade DIXON TECHNOLOGIES (INDIA) LIM stock right from TradingView charts — choose your broker and connect to your account.
Investing in stocks requires a comprehensive research: you should carefully study all the available data, e.g. company's financials, related news, and its technical analysis. So DIXON TECHNOLOGIES (INDIA) LIM technincal analysis shows the buy rating today, and its 1 week rating is buy. Since market conditions are prone to changes, it's worth looking a bit further into the future — according to the 1 month rating DIXON TECHNOLOGIES (INDIA) LIM stock shows the strong buy signal. See more of DIXON TECHNOLOGIES (INDIA) LIM technicals for a more comprehensive analysis.
If you're still not sure, try looking for inspiration in our curated watchlists.
If you're still not sure, try looking for inspiration in our curated watchlists.