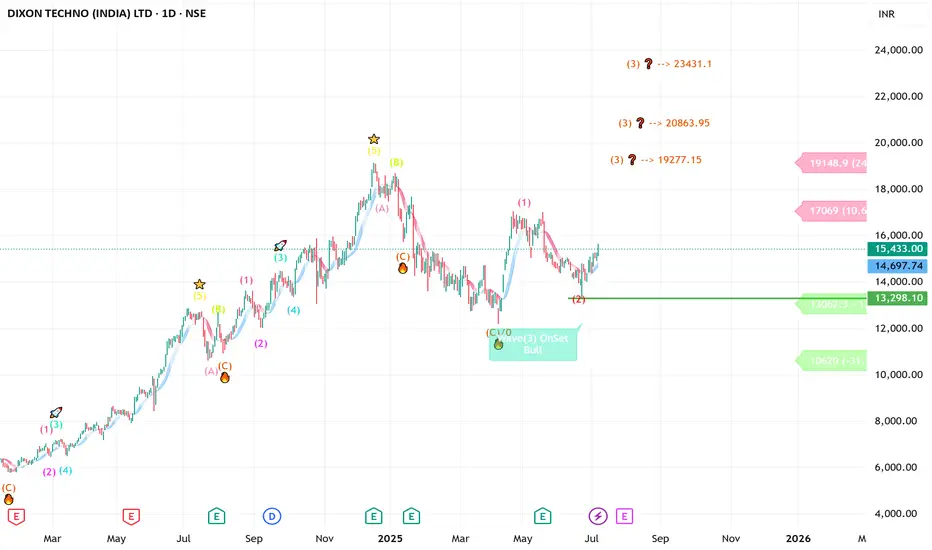
DIXON -----Daily counts Fresh Implus start anytime -UpsideDIXON -----Daily counts indicate Excellent bullish wave structure.
Both appear to be optimistic and this stock invalidation number wave 2 low
target short / long term are already shared as per charts
correction wave leg seems completed
Investing in declines is a smart move for short/ long-term players.
Buy in DIPS recommended
Long-term investors prepare for strong returns over the next two to five years.
one of best counter
Every graphic used to comprehend & LEARN & understand the theory of Elliot waves, Harmonic waves, Gann Theory, and Time theory
Every chart is for educational purposes.
We have no accountability for your profit or loss.
DIXON trade ideas
#DIXON - 4000 Pts move coming? 18246 or 9842.00?Date: 24-05-2025
#Dixon
Current Price: 14473
Pivot Point: 14044.00 Support: 13213.60 Resistance: 14882.04
Upside Targets:
Target 1: 15991.02
Target 2: 17100.00
Target 3: 18246.00
Target 4: 19392.00
Downside Targets:
Target 1: 12100.80
Target 2: 10988.00
Target 3: 9842.00
Target 4: 8696.00

DIXON techno-funda analysisDixon Technologies is one of India’s largest electronics manufacturing services (EMS) companies, operating across mobile phones, TVs, lighting, wearables, and security systems. With significant capacity, backward integration, and multiple PLI-linked verticals, it serves global brands under a B2B model. The stock is currently trading at ₹15,473.00 and is showing signs of trend continuation after a shallow retracement.
Dixon Technologies – FY22–FY25 Snapshot
Sales – ₹10,700 Cr → ₹12,900 Cr → ₹14,800 Cr → ₹16,900 Cr – Strong growth led by capacity and client expansion
Net Profit – ₹190 Cr → ₹260 Cr → ₹318 Cr → ₹410 Cr – Improving margins and operating leverage at scale
Order Book – Strong → Strong → Strong → Strong – Visibility from anchor clients and PLI-backed segments
Dividend Yield (%) – 0.07% → 0.09% → 0.10% → 0.11% – Nominal, reinvestment-led growth focus
Operating Performance – Moderate → Strong → Strong → Strong – Multi-segment margin expansion
Equity Capital – ₹11.88 Cr (constant) – Lean and efficient equity structure
Total Debt – ₹130 Cr → ₹110 Cr → ₹95 Cr → ₹85 Cr – Well-managed debt, low leverage
Total Liabilities – ₹1,540 Cr → ₹1,650 Cr → ₹1,760 Cr → ₹1,870 Cr – Aligned with scale and vertical integration
Fixed Assets – ₹640 Cr → ₹715 Cr → ₹810 Cr → ₹905 Cr – Ongoing capex into backward integration
Latest Highlights
FY25 net profit rose 28.9% YoY to ₹410 Cr; revenue rose 14.2% to ₹16,900 Cr
EPS: ₹68.96 | EBITDA Margin: 6.8% | Net Margin: 2.43%
Return on Equity: 21.75% | Return on Assets: 10.52%
Promoter holding: 33.43% | Dividend Yield: 0.11%
Expansion in wearables, laptops, and tablet manufacturing under new PLI approvals
Capacity ramp-up ongoing across camera modules, motherboard assembly, and battery packs
Technical Snapshot Dixon is trading at ₹15,473.00 with an RSI of 53.99, indicating balanced momentum with signs of bullish continuation. The price has bounced from point ‘c’ on the Fibonacci retracement structure, with three mapped upside targets at ₹17,473.05, ₹18,905.90, and ₹20,731.10. Volume activity has been steady, supporting the case for trend extension as long as the breakout holds above the neckline.
Business Growth Verdict Yes, Dixon Technologies continues to execute across high-growth verticals
Strong earnings expansion supported by deeper client wallet share
Capital allocation focused on automation, scale, and cost optimization
Multi-sector visibility with long-term PLI tailwinds intact
Final Investment Verdict Dixon Technologies remains a leading proxy for India’s electronics manufacturing ambitions. Its B2B partnerships with global brands, focus on vertical integration, and capacity-driven margin expansion enable sustainable growth. The stock is positioned for a potential re-rating if execution aligns with new PLI-led volumes. While valuations are rich, consistent delivery across product categories and financial strength makes this a strategic long-term compounder for those seeking high-RoE industrial growth exposure.

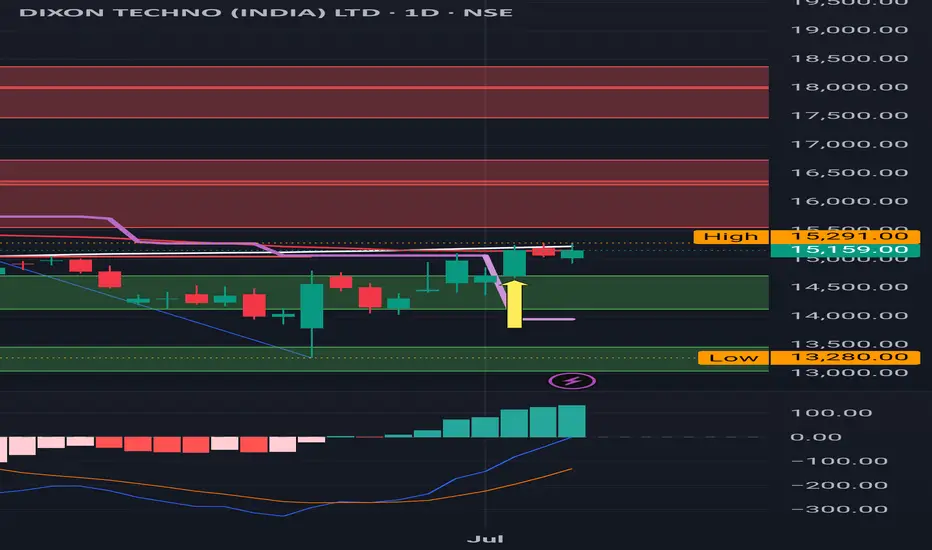
Dixon: Buy triggered, be mindful of a Red Band resistance Dixon: Buy triggered, be mindful of a Red Band resistance .
( Not a Buy / Sell Recommendation
Do your own due diligence ,Market is subject to risks, This is my own view and for learning only .)
DIXON Technologies – Bearish Analysis📉 DIXON Technologies – Bearish Analysis
Timeframe: 15-minute
Trend: Clearly downward with consistent Lower Highs and Lower Lows
Indicators:
EMA Ribbon :
Price is currently below all EMAs, which are fanned out and sloping down — confirming strong bearish momentum.
EMA ribbon is acting as a dynamic resistance zone.
🧭 Key Chart Observations:
🔺 Resistance Zones:
₹14,588–14,706: Identified confluence of Fibonacci 61.8% retracements and previous supply zones.
Price rejected from this zone multiple times, validating it as a strong resistance.
🔻 Immediate Breakdown Zone:
₹14,350–14,400: Short-term demand zone where price is hovering.
Breakdown from this level will confirm continuation of the lower low structure.
🎯 Bearish Targets:
Target 1: ₹13,766
First minor support; aligns with Fibonacci -0.89 extension
Target 2: ₹13,292
Based on prior swing structure
Final Target: ₹13,078 – highlighted as your primary expectation
Extended Target: ₹12,899
Deep extension if breakdown continues with momentum
❗ Stoploss:
Above ₹14,653, which is just above the swing high and 61.8% Fib level — logical place to invalidate the bearish thesis.
📌 Strategy Suggestion:
Short Entry: Below ₹14,350 (confirmation breakdown)
Stoploss: ₹14,653 (above EMA resistance zone)
Targets:
T1: ₹13,766
T2: ₹13,292
Final: ₹13,078 (as per your marked level)
🔍 Summary:
DIXON is in a clear downtrend on the 15-min chart with EMA ribbon resistance, Fibonacci confluence rejection, and bearish swing structure. Unless price breaks above ₹14,653, downside momentum is likely to continue toward the ₹13,100–₹13,000 zone.
⚠️ Disclaimer:
This analysis is for educational and informational purposes only and does not constitute investment advice. Trading and investing in markets involve risk. Please do your own research or consult a financial advisor before making any trading decisions.

DIXON : After a Sell Signal , downward trend continues
DIXON : Sell Signal.
Downward trend continues from 17025.
Turned into a Sell Signal.
It's under 200 SMA now
MACD also is negative .
Major Support is @ 12000+
( Not a Buy / Sell Recommendation
Do your own due diligence ,Market is subject to risks, This is my own view and for learning only .)

DIXON WILL FALL TILL 12800 for short termDixon Tech is in downtrend for long term trend and it will fall till 12800 in short term , so watch it, and then observe price action,

Nalco - Harmonic Pattern Analysis and outlookNATIONAL ALUMINIUM CO LTD: CMP- 183.84;
📉 Suggested Pattern:
- BAT harmonic pattern completion.
📊 Recent Price Action:
- Shares of National Aluminium Company Limited closed below the previous closing price.
- Formation of a Lower Low, reinforcing bearish sentiment.
📈 Forecast:
- Potential Downside Target: ₹166.
- Expected Consolidation Range: ₹150-₹160.
🔍 Key Observations:
- The bearish trend suggests a continuation of the decline in the coming days.
- Important to monitor price action and volume dynamics for further confirmation

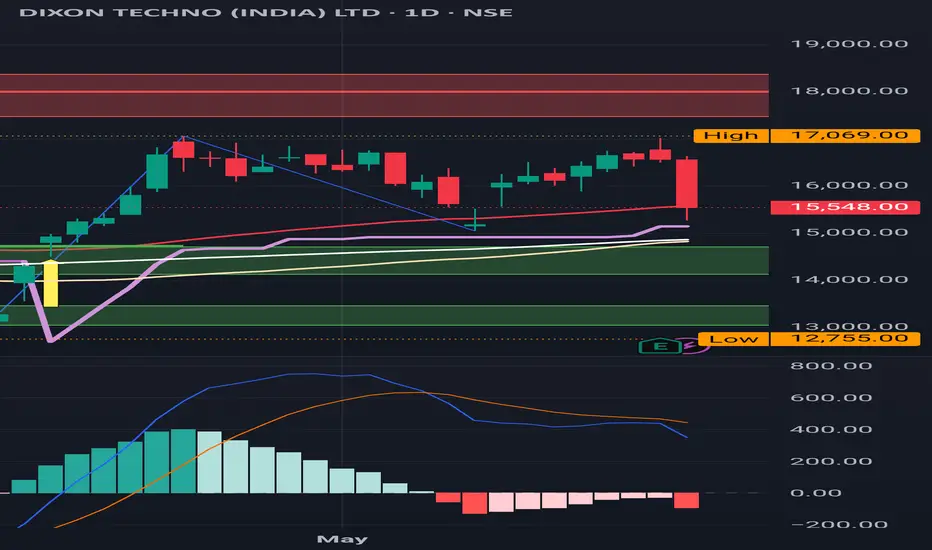
Dixon : Couldn't clear the resistance of 17069 .
Dixon : Couldn't clear the resistance of 17069 this time as well.
Another Major resistances in the form of Red
Bands are clearly displayed on the chart at around 18000+ level .
( Not a Buy / Sell Recommendation
Do your own due diligence ,Market is subject to risks, This is my own view and for learning only .)
Dixon Technologies | Head & Shoulders Breakdown | Bearish Target📝 Analysis:
Dixon Technologies (NSE: DIXON) is forming a classic Head and Shoulders pattern, signaling a potential trend reversal from bullish to bearish.
The pattern structure is clear:
Left Shoulder: Formed after a rally and minor correction.
Head: Made a higher high but failed to sustain.
Right Shoulder: Lower high formation indicating weakness.
📉 Bearish Breakdown Trigger:
A decisive break below the neckline will confirm the bearish setup.
Expect increased selling pressure post-breakdown.
🎯 Target Projections:
Initial Targets:
₹16,196 (Fib 0.25)
₹15,790 (Fib 0.5 Mid-point)
₹15,384 (Fib 0.75)
Major Support:
₹13,579 (Horizontal Key Support)
Extended Bearish Targets:
₹12,095 (Triple Support)
₹10,617 (Quadruple Support)
🔎 Key Observations:
Price consolidation within a range indicates distribution.
Momentum loss is visible as the stock fails to create higher highs.
Breakdown below ₹15,790 will accelerate downside momentum.
⚠️ Risk Management:
Traders should wait for a confirmed neckline breakdown before shorting.
Keep strict stop-loss above the right shoulder peak to manage risk.
🟡 Disclaimer:
This analysis is for educational and informational purposes only. It is not investment advice. Please consult your financial advisor before making any trading decisions. Trading involves risk and may result in financial loss.

DIXON – Complex H & S Pattern Formed – Bearish Outlook📉 DIXON – Complex Head & Shoulders Pattern Formed – Bearish Outlook
Timeframe: 15-minute chart
Date: May 5, 2025
🔍 Chart Pattern Observed:
DIXON has formed a Complex Head and Shoulders (H&S) pattern, which is typically a trend reversal pattern. This specific setup consists of:
Two Left Shoulders (LS#1 and LS#2)
One Central Head
Two Right Shoulders (RS#1 and RS#2)
This complexity often adds higher reliability to the pattern due to multiple retests of key resistance zones.
📊 Technical View:
The neckline of the H&S pattern has been tested multiple times.
Currently, the price is hovering near the end of Right Shoulder #2, which suggests the possibility of a near-term top.
A break below the neckline with strong volume could trigger a sharp downside move.
📉 Bearish Scenario Projection:
Once the neckline is decisively broken, downside targets could extend toward the ₹15,000–₹14,600 zone.
This matches the height of the head projected downward from the neckline.
🛑 Risk Management:
Invalidated if price closes strongly above ₹16,900, breaching RS#2 high.
Watch for breakdown confirmation with volume spike and bearish follow-through candles.
🔔 Conclusion:
DIXON shows signs of exhaustion after a strong uptrend and has printed a reliable complex reversal pattern. Traders should watch for confirmation below neckline support to initiate short positions. Be patient and wait for a clear trigger to avoid premature entries.
📌 Disclaimer: This analysis is for educational purposes only and does not constitute trading or investment advice. Always consult your financial advisor before making any trading decisions.

Dixon in bearish zoneJadugar and Paka Kam generated signals Becho @ 16217 means sell at 16217, lets see how much it will fall.

Dixon : After a fantastic rally and a buy ,feeling a pressure
Dixon : After a fantastic rally from the support and turning into a buy it seemes it is feeling a pressure at the resistance level of 15700.
Candles also are small.
( Not a Buy / Sell Recommendation
Do your own due diligence ,Market is subject to risks, This is my own view and for learning only .)

Long term buyLooking at the exponential growth in revenue over the past few years and relatively lower valuation (based on the price to sales ratio or revenue per share), upward trajectory looks very very promising.

Review and plan for 3rd April 2025 Nifty future and banknifty future analysis and intraday plan in kannada.
This video is for information/education purpose only. you are 100% responsible for any actions you take by reading/viewing this post.
please consult your financial advisor before taking any action.
----Vinaykumar hiremath, CMT

Expanding Triangle Pattern Analysis – DIXON (India)Pattern Formation Overview:
The uploaded chart of DIXON suggests the formation of an Expanding Triangle (Broadening Formation), a pattern characterized by higher highs and lower lows, reflecting increasing volatility. This pattern typically forms in a corrective or consolidation phase before a decisive breakout.
Key Characteristics of the Expanding Triangle in DIXON:
Expanding Swings:
The price is making higher highs (point 2 & 4) and lower lows (point 1 & 3).
This widening structure indicates an increasing level of price instability.
Current Market Position:
Wave 4 has recently completed at a resistance zone.
Price is now starting the downward leg (Wave 5) toward the expected target of 12,700-12,400.
Bearish Breakdown Expected:
The next move is projected to be a strong downside move as price follows the expanding triangle structure.
The target is near 12,700, aligning with Fibonacci extensions.
If selling pressure increases, the 2.618 Fibonacci extension (~12,400) could be the final stopping point.
Key Support & Resistance Levels:
Resistance Zone (Wave 4 Peak): 13,500-13,600
If price breaks above this level, the bearish view may be invalidated.
Support Zone (Target Levels):
12,700 (Primary Target)
12,400 (Extended Target) based on Fibonacci confluences.
Confirmation Factors:
A break below 13,200 will confirm the bearish move.
Volume should increase on the breakdown for added conviction.
Conclusion:
Expanding Triangle suggests higher volatility and a final bearish move.
Watch for breakdown confirmation below 13,200.
The expected target is around 12,700, with an extended move possible to 12,400.
Disclaimer
⚠️ This analysis is for informational and educational purposes only. It does not constitute financial advice, investment recommendations, or trade execution strategies. Trading involves significant risk, and you should conduct your own research or consult a financial advisor before making any decisions. Past performance does not guarantee future results. Trade at your own risk.

Review and plan for 11th March 2025 Nifty future and banknifty future analysis and intraday plan.
This video is for information/education purpose only. you are 100% responsible for any actions you take by reading/viewing this post.
please consult your financial advisor before taking any action.
----Vinaykumar hiremath, CMT

DIXON | Short @13460 with a SL 13720 | Min. Target 12000LOT Size : 50
Loss : 14,000/-
Profit : 73,000/-
Disclaimer:
This is not financial advice. Please do your own research or consult with a financial advisor before making any investment decisions. Investments in stocks can be risky and may result in loss of capital.

Levels to watch for Once market closes below the marked levels expect it to slide towards 7000 in the coming months
Best to buy around those levels then average out positions

Dixon Tech Bearish View In Dixon TechDixon Technologies (India) Limited, incorporated in 1993 , is a Electronic Manufacturing Services (EMS) company with operations in the electronic products vertical such as consumer electronics, lighting, home appliance, closed-circuit television cameras (CCTVs), and mobile phones. It also undertakes reverse logistics operations. Besides, it manufactures security surveillance equipment, wearables & audibles, AC-PCBs. Recently, it has entered a JV with Imagine Marketing Private Limited for designing and manufacturing wireless audio solutions in India

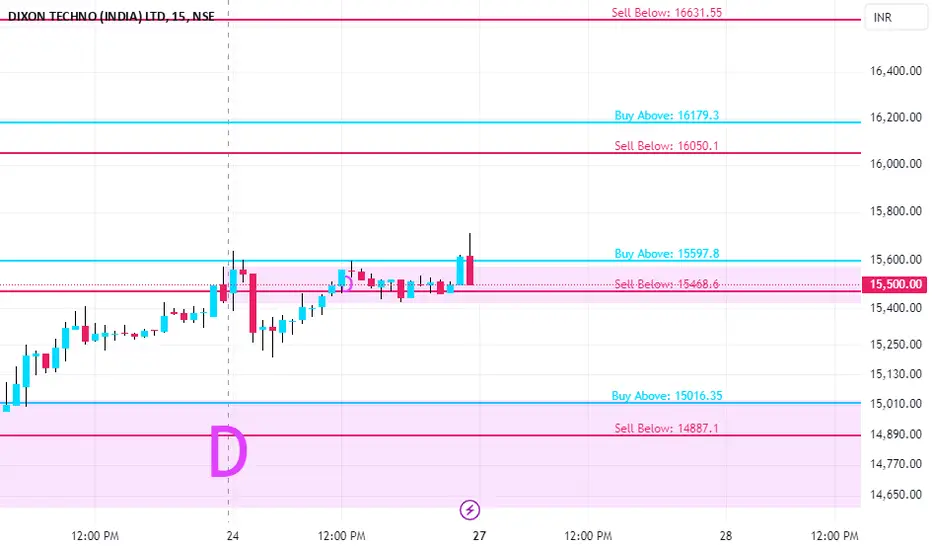
DIXON KEY LEVELS FOR 27/01/2025**Explanation:**
This trading system helps you avoid blind trades by providing confirmation for better entries and exits.
**Entry/Exit Points:**
- **Entry/Exit Lines:** Use the BLACK line for long trades and the RED line for short trades, based on confirmation from your trading plan.
- **Stop Loss:** For long trades, set the stop loss at the RED line below. For short trades, set it at the BLACK line above.
- **Take Profit:** For long trades, target the next RED line above. For short trades, target the next BLACK line below.
**Timeframe:**
Use a 5 timeframe for trading.
**Risk Disclaimer:**
This setup is for educational purposes. I'm not responsible for your gains or losses. Check the chart for more details.
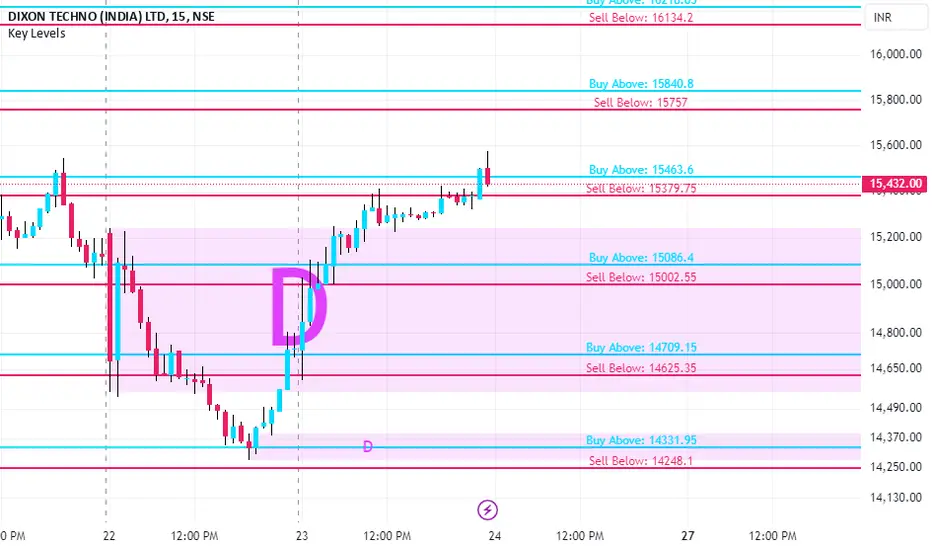
DIXON KEY LEVELS FOR 24/01/2025**Explanation:**
This trading system helps you avoid blind trades by providing confirmation for better entries and exits.
**Entry/Exit Points:**
- **Entry/Exit Lines:** Use the BLACK line for long trades and the RED line for short trades, based on confirmation from your trading plan.
- **Stop Loss:** For long trades, set the stop loss at the RED line below. For short trades, set it at the BLACK line above.
- **Take Profit:** For long trades, target the next RED line above. For short trades, target the next BLACK line below.
**Timeframe:**
Use a 5 timeframe for trading.
**Risk Disclaimer:**
This setup is for educational purposes. I'm not responsible for your gains or losses. Check the chart for more details.
#DIXON UP Trend continue. #DIXON
UP Trend continue.
Reversed from FLIP Zone.
New ATH may possible.
Just for Educational purpose, I am not SEB Registered.
