DMART down 40% from ATH; consolidation expected at 3100–2500DMART has seen a significant correction, dropping 40% from its all-time high. The stock is likely to consolidate between the 3100–2500 range, presenting a potential buying opportunity for long-term investors.
DMART trade ideas

DMARTBASE ON BASE
More than 2 yrs of consolidation
Sector support
high volume on BO
SHAKE OUT at 50 EMA
Support at 50 EMA
LOW RISK/HIGH REWARD

Dmart, an opportunity for re bounce As per technical chart setup, and current price also on major support, hopefully an upside rally seen in upcoming sessions. add this script on your watch list.

Dmart , good weekly long tradeDmart , good weekly long trade.
Quick 10% upside it it gives bounce from the current level.
Not for investment as of now, as the stock is ranging

Is the fall over in Avenue Supermarts Ltd (DMART)?Price is moving in a broadening wedge pattern which is also known as expanding diagonal.
All the sub waves are 3 wave structures which are usually found in ending diagonal in wave 5 of an impulse or wave C of a correction.
Currently price is in sub wave 4 of the primary wave 5 which is going to end somewhere near 3900 level.
Wave 5 should end near 7700 level which is also the technical target for the classical saucer pattern.
All the illustrations are self explanatory.
More than 90% gains potential from CMP in medium term.
What you see here in the chart is just the tip of an iceberg, all the hard work cannot be shown.
If you are getting benefitted from my hard work then showing gratitude won't cost you a dime.
It can definitely motivate me to publish more charts which will benefit you further.
Do your own due diligence before taking any action.
Peace!!

DMART LONGDMART - Set ups
MTF Analysis
DMART Yearly Demand Beakout 2790
DMART 6 Month Demand Breakout 3408
DMART Qtrly Demand 3330
DMART Monthly Demand DMIP 3948
DMART Weekly Demand DMIP 3739
DMART Weekly Demand BUFL 3741
ENTRY -1 3741
SL 3644
RISK 97
Taget as per Entry 7421
Points to Gain 1,840
Latest Last Swing High 5484
Latest Last Swing Low 3644

D MART WEEKLY DEMAND ZONEDMart is in the weekly demand zone,
This demand zone is made up of 2 explosive candles so the probability of it working is high.

Dmart LongDMART
MTF Analysis
DMARTYearly Demand Breakout 4206
DMART 6 Month Demand Breakout 4588
DMARTQtrly Demand Breakout 4605
DMARTMonthly Demand DMIP 3952
DMARTWeekly Demand 4330
DMARTDaily Demand DMIP 4440
ENTRY -1 4440
SL 4250
RISK 190
Potential Target 6720
First Target Points 5485
First recovery Target Points 1235
Last Swing Low 4250
Last Swing High 5485
RR 7
RR 51%

DMART RANGE BREAKOUT VOLATILITY COMPRESSIONDmart Given BO on Daily TF
Volumes Increasing
Its VSP type pattern.. Volatility Compression BO
Expecting Good Target
Todays Closing Deciding factor.
Idea Invalid If dynamic Support Broken on Downside

DMART S/R Support and Resistance Levels:
Support Levels: These are price points (green line/shade) where a downward trend may be halted due to a concentration of buying interest. Imagine them as a safety net where buyers step in, preventing further decline.
Resistance Levels: Conversely, resistance levels (red line/shade) are where upward trends might stall due to increased selling interest. They act like a ceiling where sellers come in to push prices down.
Breakouts:
Bullish Breakout: When the price moves above resistance, it often indicates strong buying interest and the potential for a continued uptrend. Traders may view this as a signal to buy or hold.
Bearish Breakout: When the price falls below support, it can signal strong selling interest and the potential for a continued downtrend. Traders might see this as a cue to sell or avoid buying.
20 EMA (Exponential Moving Average):
Above 20 EMA: If the stock price is above the 20 EMA, it suggests a potential uptrend or bullish momentum.
Below 20 EMA: If the stock price is below the 20 EMA, it indicates a potential downtrend or bearish momentum.
Trendline: A trendline is a straight line drawn on a chart to represent the general direction of a data point set.
Uptrend Line: Drawn by connecting the lows in an upward trend. Indicates that the price is moving higher over time. Acts as a support level, where prices tend to bounce upward.
Downtrend Line: Drawn by connecting the highs in a downward trend. Indicates that the price is moving lower over time. It acts as a resistance level, where prices tend to drop.
RSI: RSI readings greater than the 70 level are overbought territory, and RSI readings lower than the 30 level are considered oversold territory.
Combining RSI with Support and Resistance:
Support Level: This is a price level where a stock tends to find buying interest, preventing it from falling further. If RSI is showing an oversold condition (below 30) and the price is near or at a strong support level, it could be a good buy signal.
Resistance Level: This is a price level where a stock tends to find selling interest, preventing it from rising further. If RSI is showing an overbought condition (above 70) and the price is near or at a strong resistance level, it could be a signal to sell or short the asset.
Disclaimer:
I am not a SEBI registered. The information provided here is for learning purposes only and should not be interpreted as financial advice. Consider the broader market context and consult with a qualified financial advisor before making investment decisions.
Avenue Supermarts Ltd
Target > Refer Fibonocci
SL - 4733
FUNDAMENTALS
Market Cap
₹ 3,43,262 Cr.
Current Price
₹ 5,275
High / Low
₹ 5,449 / 3,616
Stock P/E
129
Book Value
₹ 287
Dividend Yield
0.00 %
ROCE
19.4 %
ROE
14.5 %
Face Value
₹ 10.0
Price to book value
18.4
Intrinsic Value
₹ 971
PEG Ratio
5.63
Price to Sales
6.48
Debt
₹ 592 Cr.
Debt to equity
0.03
Int Coverage
61.8
Reserves
₹ 18,047 Cr.
Promoter holding
74.6 %
Pledged percentage
0.00 %
EPS last year
₹ 39.0
Net CF
₹ 130 Cr.
Price to Cash Flow
125
Free Cash Flow
₹ 24.0 Cr.
OPM last year
8.08 %
Return on assets
12.8 %
Industry PE
64.4
Sales growth
18.6 %

DMART, Moving towards ATHDmart cup and handle pattern breakout done
Moving towards All time high
strong fundamentals

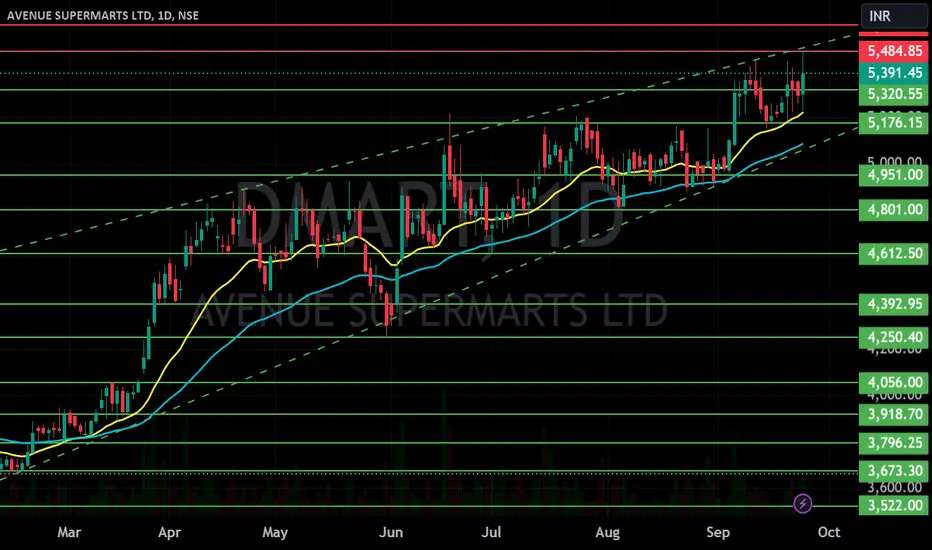
Dmart- Bullish Swing-Will ascending channel continue its path? NSE:DMART
20.08.2024
Buy- 5090
Target-5275
Stop Loss-4883
Risk Reward-1:1
Price is creating multiple HH & HL after a good breakout in March 2024
Price is again approaching all time high which has previously reached in 2021.
1.Breakout- Inside bar
2.Trend- Upward range
3.KeyLevel- Bounced from Key support level
4.Volume- Good volumes in breakout candle in last few sessions
5. EMA- 21 EMA Rejection & price above 50 EMA
6. RSI- Bullish indication


Dmart - Avenue Supermart - Nearing breakoutStrong resistance at 5000-5100 level. Once it crosses this level, and gives weekly closing comfortably above 5200, stock can show strength for breaking its multi year high. Not a reco. Just for self-analysis.

DMART weekly - upside potentialExpecting DMART to going towards 5900 in the next few months as long as 5800 holds on Daily closing basis.
Below are some near term targets that are possible imo within next 2-3months
T1 - 5200
T2 - 5300 and
T3 - 5500
Stop loss will be losing 4800 on Daily closing basis
PS: While the above is my personal opinion, do your own research in case playing with Futures/Options as most traders tend to lose money

DMART - Momentum is building for upside move - Time to go LONG!DMart looks like it has bottomed out, presenting an opportunity for a long trade with a tight stop loss in place!
Trade Idea Explanation:
- Entry Point: Best around 4300+
- Stop Loss: Tight SL to 4100 on closing basis of D tf candle
- **Target:** Expecting a significant upside around 5900++
Stay updated for further insights and trade safely!
If you have liked the analysis, don't forget to leave a comment and boost the post. Happy trading!
Disclaimer: This is NOT a buy/sell recomendation. This post is meant for learning purposes only. Please, do you due diligence before investing.
Thanks & Regards,
Anubrata Ray

Dmart (AVENUE SUPERMARTS) GIVES BRAKEOUT ON DAILY CHART NSE:DMART
Dmart (AVENUE SUPERMARTS) GIVES BRAKEOUT ON DAILY CHART
i will Buy near 4800
with sl 3800
for target of 5950.
risk reward ratio is 1:1
return on capital is 20%

DMART LONGAvenue Supermarket on Weekly Support 4700-4400 Its a Weekly BULF Zne - & Daily Demand 4750-4640- Expecting 4700-4600 will act as strong support - upside Target 5400

Dmart chart analysisDmart chart analysis on daily time frame. Please give your valuable feedback and follow if you like my analysis

DMART now on Moon and getting ready for MarsThe accumulation phase of Tata Investment Corporation Limited shares indicates a strong belief in the company's potential for future growth and returns. The company’s solid financial performance, strategic investments, and affiliation with the Tata Group make it an attractive investment. Investors looking for a balanced portfolio with potential for steady growth and regular income may consider TataInvest as a viable option. However, it is essential to conduct thorough research and consider individual investment goals and risk tolerance before making any investment decisions.

DMart: Ready for new Highs with Bullish StructureClassical inverted H&S Pattern Structure can be seen in this script.
Following points can be considered here before taking any decision:
1. over all Trend is uptrend.
2. Pattern: Bullish IH&S(After healthy Consolidation) Or Inside bar or multiple Resistance BO or Cup and Handle
3. Good Fundamentals
4. over all market structure is also bullish.
DISC: For educational Purposes only. Please consult your financial advisor before taking any position.

