EXIDEIND trade ideas


EXIDEIND above 213take position only after verifying script yourself , this is just I'm learning and sharing my idea to get guidance from community to learn more


BUY EXIDEIND ABOVE 178 Target 191/205/228 Stop Loss BELOW 170The results in the fourth quarter is above expectations and on the price action again touching the covid low's support line which is a good enough indication for the reversal and further up trend . Traders can follow the above mentioned targets with given stop loss.


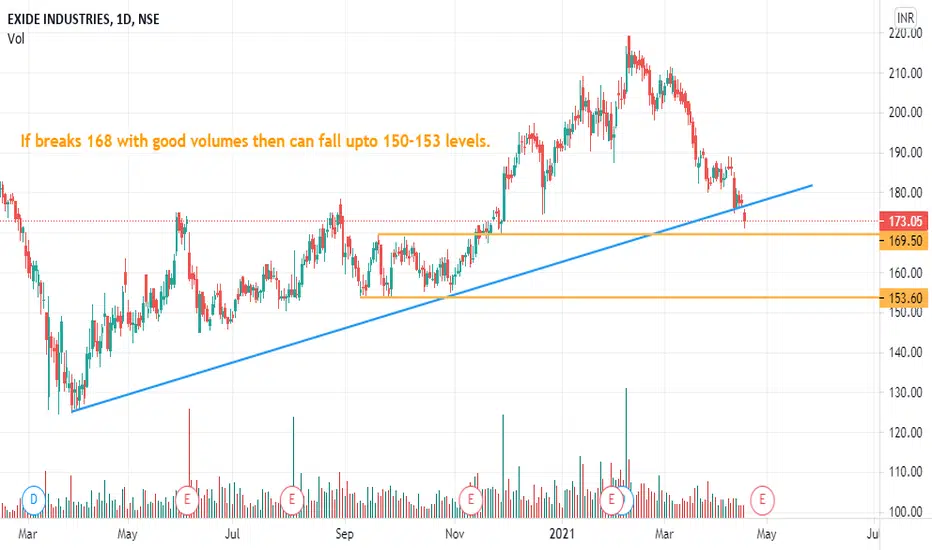
EXIDE INDUSTRIES- Daily ChartStock has been very much under performing recently so keep an eye. All levels are mentioned in the chart.
EXIDE IND 1 DAY ANALYSIS FOR SWING WAIT FOR 188 TO BREAK AS EXIDE IND HAS SHOWN SOME VOLUMES AS WELL AS DUE TO THE FUTURISTIC VIEW FOR ELECTRIC VEHICLES
BATTERIES STOCKS ARE MORE ON FOCUS SO INVESTOR CANT MISS THE OPPORTUNITY TO BUY ON DIP OR ANOTHER SWING
STOCK IS ON EXTREME SUPPORT SO WE WILL ENTER AFTER OUR LEVEL GETS BREAK WITH HIGHER HIGH FORMATION


EXIDE IND 1 DAY ANALYSIS FOR SWING WAIT FOR BREAKOUT WITH VOLUMEEXIDE IND IN CHANNEL WAIT FOR BREAK FOR SWING


exide will excite you if it breaks the red trendline againgood opportunity looking for exide as it is making hh hl uptrend formation , good call for swing trade.
breakout closing above 208 will be a good signal to buy

EXIDEIND Breakout will happenEXIDEIND making a channel pattern for last 3 months, CMP 208.
SHORT side Targets are 201.25 then 196.
LONG side Targets are 214.5 then 225.

Exide weekly chartBreakout in weekly chart. If it sustain this week we can trust it. This is only for educational purpose.


EXIDE FUTMorning gap opens then it will rally further with approx 6 to 10 pts.
Morning gap down then it will break down to 210 and then 205.

Exide { Short 15 M }IB formed following 3 to 4 big green candles , rest is as per charts
Note :-
Entry - At the break of mentioned candle's low/high
Stop Loss -
In a Short Trade, I always use Previous Candle High ( PCH ) as a stop loss while entering the trade. Sometime I might use 15 M tf SL & trade in 30M tf which I'll mention. Vice Versa for long trades
Trailing Stop Loss ( TSL ) - Mostly I trail stop loss by PCH as price falls . I exit as PCH breaks & vice versa
Use of PSAR as TSL :- TSL get's hit in trend following due to noise, In such cases I use PSAR to be in trend & exit if PSAR direction change
You can use any one of above mentioned or your own way to manage risk
Time Frame :- I take ~ 90% of my intraday trades in 15m tf. Where my analysis might come from higher frames like W , D or 1hr chart pattern which will be mentioned.
Target :- I do set target line based on support / resistance slightly above/ below it . Please pay attention to it


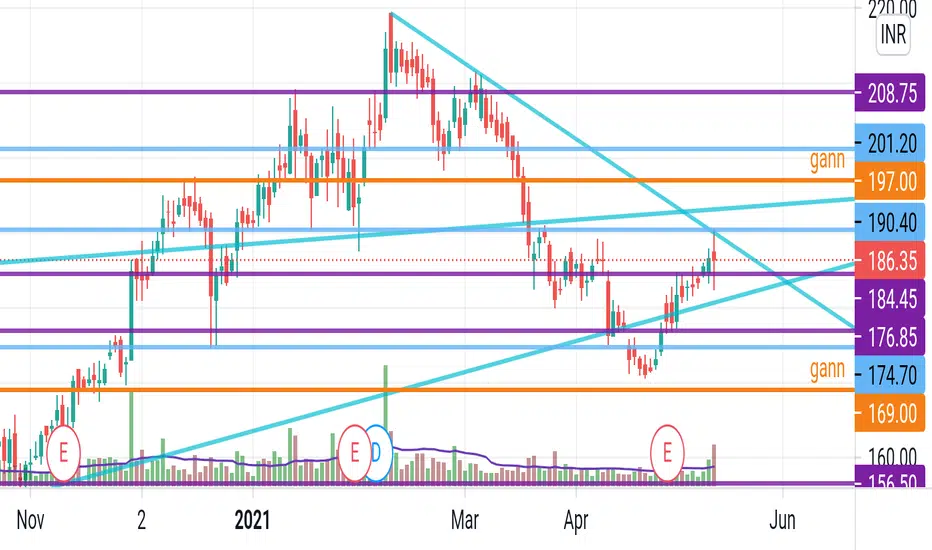
EXIDE - Multiple confirmation trade opportunity - Swing TradeThe above analysis is done purely based on price action and chart patterns.
The analysis is done on daily TF hence price may take few days to few weeks in order to reach the targets.
(This stock was analysed few months ago as well. To check that analysis, see the idea linked below)
The logic behind this analysis is explained in image itself. It is a multi-confirmation trade opportunity.
(Pls note that even after multiple confirmation, there's always a chance of trade going in opposite direction, hence trade as per your own risk management & position sizing)
Entry can be made between 190-CMP.
Targets and SL is shown in image itself with proper logic.
The zoomed-in image to show the formation of morning star reversal pattern at 0.618 Fibo level is below -
Zoomed-in image showing formation of Bull Flag pattern is below -
The above analysis is purely for educational purpose. Traders must do their own study before entering into any trade. Traders must trade as per their own risk taking capacity and money management. [/ b]
Feel Free to comment for any queries regarding the above stock or price action analysis in general.
Also check out my other ideas to understand how price action works and how it can be used to make regular profits without any complex strategies.

