GAIL trade ideas
Gail- CMP 120.15GAIL- CMP 120.15, It is in bullish trend. EMA cross overs have happened at 90 levels which is good indicator for rise. After recent correction its RSI is crossing the trend line above and which is also bullish in nature. In short time it may go up to 132 levels and may face resistance at that price. This is for educational purpose and any investment shall be done by experts.
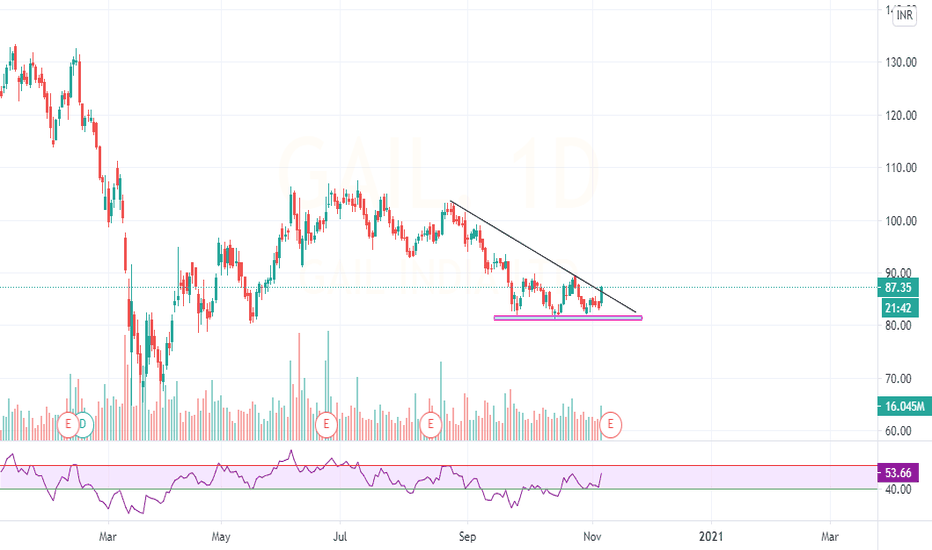
GAIL INDIA LTD getting ready for a bull ride?GAIL INDIA LTD has settled up by 4.28 percent at 90.20 paisa on Tuesday. Stock has today broken through a 50 days rectangular consolidation along with MACD developing bullish divergence with a bullish cross. Stochastic is also above its signal line and sloping upward favouring bullish momentum. A tweezer bottom combination is formed near 85.50 that was also near the mid of a bullish trend. Based on structure developed on daily chart one can look for long opportunities in this stock around 88.50-87.50 zones with a stop loss below 85.50 for targeting 98-104 in coming days.
Gail bullish double bottom pattern Double Bottom pattern formed with very high volumes at the end on 5 min chart
Make sure you stay bullish if the market sentiment is bullish
keep checking out the Metal sector every now and then and keep your target likewise
For risk takers you can go bullish and keep a tight stop loss and then a trailing stop loss to book profit
will suggest everyone to ride the trend if possible


