Glaxo Bullish Breakout – Long Opportunity Ahead!Title: Glaxo Weekly & Monthly High Breakout – Bullish Momentum Incoming!
Description:
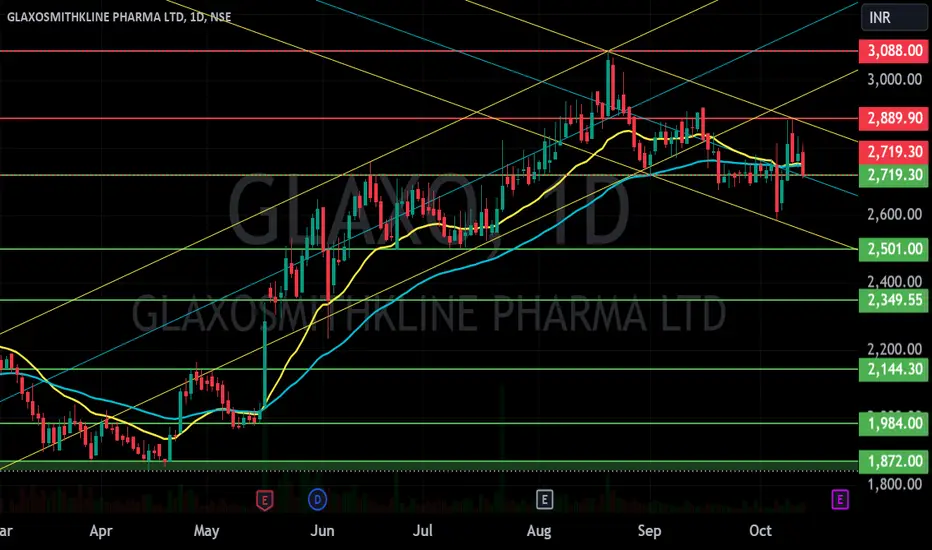
Glaxo has broken above both its weekly high and monthly high, confirming strong bullish momentum. The breakout is accompanied by high bullish volume, indicating strong participation from buyers and increasing confidence in further upside movement.
Key Technical Factors:
✅ Breakout Confirmation: Price has decisively closed above both the weekly and monthly resistance levels, converting them into potential support zones.
✅ Bullish Volume Spike: A significant increase in volume suggests institutional buying, confirming the strength of the breakout.
Trade Plan:
📌 Entry: Above the breakout level, ideally on a retest with confirmation.
🎯 Targets:
Short-Term: Previous swing high as the first target.
Conclusion: Glaxo is showing strong bullish strength with volume confirmation, making it a high-probability long setup. Monitor price action and volume on pullbacks for an ideal entry! 🚀📈
GLAXO trade ideas

glaxoDrugmaker reports 35% Y/Y jump in third-quarter adjusted profit, rev up 18% Y/Y
** GLAX's profit growth driven by strong demand for its respiratory drugs and antibiotic Augmentin, while demand for its vaccines also boosted earnings

glaxoDrugmaker reports 35% Y/Y jump in third-quarter adjusted profit, rev up 18% Y/Y
** GLAX's profit growth driven by strong demand for its respiratory drugs and antibiotic Augmentin, while demand for its vaccines also boosted earnings

GLAXO---accumulateWe are presently highly oversold and MACD might start to cross over as we are near to bottom-line of trend and below 50% retracement .Share can be bought with a small stoploss of 100 rs and would be a good stock to add in your porfolio.

GLAXO S/R Support and Resistance Levels:
Support Levels: These are price points (green line/shade) where a downward trend may be halted due to a concentration of buying interest. Imagine them as a safety net where buyers step in, preventing further decline.
Resistance Levels: Conversely, resistance levels (red line/shade) are where upward trends might stall due to increased selling interest. They act like a ceiling where sellers come in to push prices down.
Breakouts:
Bullish Breakout: When the price moves above resistance, it often indicates strong buying interest and the potential for a continued uptrend. Traders may view this as a signal to buy or hold.
Bearish Breakout: When the price falls below support, it can signal strong selling interest and the potential for a continued downtrend. Traders might see this as a cue to sell or avoid buying.
20 EMA (Exponential Moving Average):
Above 20 EMA(50 EMA): If the stock price is above the 20 EMA, it suggests a potential uptrend or bullish momentum.
Below 20 EMA: If the stock price is below the 20 EMA, it indicates a potential downtrend or bearish momentum.
Trendline: A trendline is a straight line drawn on a chart to represent the general direction of a data point set.
Uptrend Line: Drawn by connecting the lows in an upward trend. Indicates that the price is moving higher over time. Acts as a support level, where prices tend to bounce upward.
Downtrend Line: Drawn by connecting the highs in a downward trend. Indicates that the price is moving lower over time. It acts as a resistance level, where prices tend to drop.
RSI: RSI readings greater than the 70 level are overbought territory, and RSI readings lower than the 30 level are considered oversold territory.
Combining RSI with Support and Resistance:
Support Level: This is a price level where a stock tends to find buying interest, preventing it from falling further. If RSI is showing an oversold condition (below 30) and the price is near or at a strong support level, it could be a good buy signal.
Resistance Level: This is a price level where a stock tends to find selling interest, preventing it from rising further. If RSI is showing an overbought condition (above 70) and the price is near or at a strong resistance level, it could be a signal to sell or short the asset.
Disclaimer:
I am not a SEBI registered. The information provided here is for learning purposes only and should not be interpreted as financial advice. Consider the broader market context and consult with a qualified financial advisor before making investment decisions.
GLAXO --ALMOST TRG HITAs per fibo extension target of 3076 approx. we might be near to long term target as negative divergence is being observed in day chart and end of 5th wave trail your stops as wave might get extended to 3200 level.

SWING IDEA - GLAXO SMITHKLINE PGlaxoSmithKline Pharmaceuticals , a major player in the pharmaceutical industry, is displaying technical signals that suggest a potential swing trade opportunity.
Reasons are listed below :
Breakthrough of Strong Resistance (1800-1900) : The 1800-1900 range was a significant resistance level. The price has broken through, retested, and is now making new highs, indicating strong bullish momentum.
Breaking a 9+ Year Consolidation Phase : The stock has emerged from a consolidation phase that lasted over 9 years, signaling a potential new long-term bullish trend.
Bullish Engulfing Candle on Weekly Timeframe : The recent bullish engulfing candle on the weekly chart indicates a significant shift towards bullish sentiment, engulfing the previous week's candle and suggesting further upward movement.
0.5 Fibonacci Support : The stock has found support at the 0.5 Fibonacci retracement level, reinforcing the potential for a continued bullish trend after a retracement.
Increased Volumes : A noticeable increase in trading volumes confirms the strength of the price move, indicating strong investor interest and participation in the current trend.
Trading at All-Time High : The stock is trading at its all-time high, suggesting strong market confidence and the potential for further gains. However, it's also important to monitor for signs of overextension or profit-taking at these levels.
Target - 2940 // 3600
Stoploss - weekly close below 1950
DISCLAIMER -
Decisions to buy, sell, hold or trade in securities, commodities and other investments involve risk and are best made based on the advice of qualified financial professionals. Any trading in securities or other investments involves a risk of substantial losses. The practice of "Day Trading" involves particularly high risks and can cause you to lose substantial sums of money. Before undertaking any trading program, you should consult a qualified financial professional. Please consider carefully whether such trading is suitable for you in light of your financial condition and ability to bear financial risks. Under no circumstances shall we be liable for any loss or damage you or anyone else incurs as a result of any trading or investment activity that you or anyone else engages in based on any information or material you receive through TradingView or our services.
@visionary.growth.insights

GLAXO PharmaTraiangle breakout with support lines
Glaxo Pharma, 1 HR Time Frame, Stock is consolidating after good breakout in weekly time frame. Keep small stop loss and trail for exit

Glaxo Breakout | Key levels | GlaxoSmithKline PharmaceuticalGlaxo Breakout | Key levels | GlaxoSmithKline Pharmaceutical
NSE:GLAXO
2462/2521 Support for
2863/3014/3370/3835

Glaxo : Buying Range: Rs. 1930-1830🌟 Stock Alert: GlaxoSmithKline Pharmaceuticals Ltd 💊
Don't miss out on this buying opportunity! Glaxo (NSE: GLAXO) is showing strong potential! 📈
🎯 Buying Range: Rs. 1930-1830
📊 Investment Highlights:
🔄 Retesting monthly support levels ✅
💼 Best buying opportunity 💰
🚨 Disclaimer:
Investing involves risks. Do thorough research and consult a financial advisor. Past performance doesn't guarantee future results. Invest responsibly. 💼💡
#GlaxoSmithKline #StockMarket #InvestmentOpportunity

GLAXO- BUYWe are at neckline we might see an end to corrective wave A as market is not that bearish buy with a small stop of 50 rs in the days to come we have a target of 2700 to 3000 for 5th wave as the stock might accumulate for next 1 to 2 month before any meaningful impulsive wave. A cash rich company with good dividend and bonus track record.

GLAXO breaking out strongly from C&H Pattern in WeeklyNSE:GLAXO has given a solid breakout in weekly charts from a cup and handle (C&H) pattern which evolved over nearly 8 years. This is significant technically.
Disclaimer: Use this only as analysis and do your own due diligence for buy/sell decisions.

BOTTOM FORMED RECENTLY SEEN BREAKOUTtriangle formed ....recent breakout from base medium to long term target wuld be around 1750

look bullish glaxo pharmaglaxo Pharma looking bullish because trand change to positive with EMA crossover 50 EMA crossed 100EMA.

GLAXO--BUYafter bottoming out at 1240 share is showing positive movement and fibo ext is showing a target of 1740-50 .

Glaxosmithkline looking good. GlaxoSmithKline Pharmaceuticals Ltd is an Indian research-based pharmaceutical and healthcare company. Their product offering include vaccines, speciality medicines & general medicines. Its prescription medicines range across therapeutic areas such as anti-infectives, dermatology, gynaecology, diabetes, oncology, cardiovascular disease and respiratory diseases.
GlaxoSmithKline Pharmaceuticals CMP is 1390.95. Negative aspects of the company are high valuation (P.E = 38.6), declining annual net profit & MFs are decreasing stake. Positive aspects of the company are improving cash from operations, no debt & zero promoter pledge.
Entry after closing above 1402. Targets in the stock will be 1435 & 1461. Long term target in the stock will be 1489. Stop loss in the stock should be maintained at closing below 1288.

Glaxo breakout expectation 21st FebGlaxo breakout expectation
Please follow strict risk reward and stop loss if you follow my levels...
Charts for Educational purposes only
Thanks,
V Trade Point

Glaxo view for today 14th FebGlaxo view triangle formation for today 14th Feb
Buy chance above 1268
Sell below 1225
Follow strict risk rward and stop loss if u follow the level
Charts for Educational purposes only
Thanks,
V Trade Point

GLAXO - Has held in 900-1800 for 9 YearsSupply emerged around 1800 in Dec'21
Plan ahead, to Purchase Breakout above 1500
or, rejection indications near 1200
PB 8x
PE 13x
ROCE 33%
Div 6%

GLAXO LONGGLAXO LONG
Long term triangle formation.
Now near breakout levels. With targets of 2100 in medium term.
No recommendations, just view.

Glaxo BreakoutGlaxo giving a breakout with a less than 61 % Fib retraction. Im entering at 1770 with a view to exit at + 6 %.

GSK Breakout RetestThe stock has broken out and retested, therefore may undergo a reversal rally. Trade is supported by brokerage calls and Supports Nearby.
Risk Reward Ratio - 2.5:1
SL is placed below support zone & the lower trendline. The target is placed near resistance.

Glaxo 5Yrs Patters BreakoutStill price is in Resistance, good bet is once the price resting the pattern support line
