GLENMARK trade ideas

Bearish Bat Sell PRZ 652-655 SL 665 TARGET 633/621Bearish Bat Sell PRZ 652-655 SL 665 TARGET 633/621


Glenmark, Double TopDouble Top pattern. One may keep a small SL and go short. 660 can be the short term target.

Any comments ? Glenmark chart seems to be following the same pattern as shown in the chart.
link to my previous analysis is here.
we can see another leg down up to 624.
*****THIS IS JUST FOR EDUCATIONAL PURPOSES NOT A TRADING ADVICE . DONT FOLLOW MY CHART ANALYSIS FOR YOUR TRADING DESCISIONS *****

Glenmark - Ready to fly?Glenmark is sitting on right positions. There is 2 things consider to be Notice.
1- Falling Wedge in a week time frame. It's a bullish breakout pattern We just need to wait for the confirmation only.
2- Second is there is the idden bullish divergence which is also a bullish pattern..
Glenmark PharmaTrendline break showed change in trend from up-trend to down-trend, so the current rally should only be a counter rally, and price should continue with the down-trend from here.


Glenmark LongBullish reversal shown by blue Stochastic line trying to cross above the red one... base formation at 560...
Long for expiry till 26-07-2018
Target - 582 - 588
Stop loss- 555
Disclosure : for eductional purposes

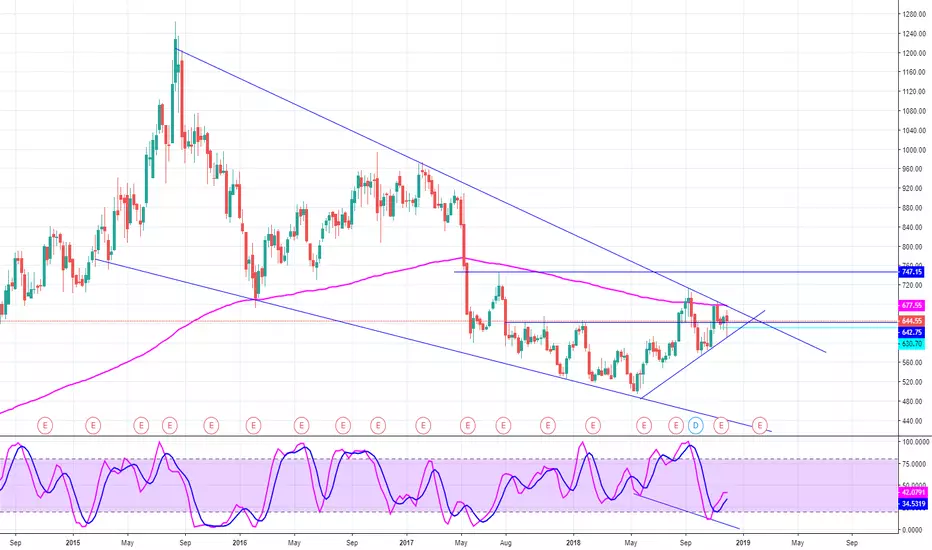
GlenmarkPharmaTwo/three signs of trend reversal and probable confirmation. After trading below 200 DMA in June 2017, the stock was under strong bear grip. At present it moved above 200 DMA and 50 is crossing 100 DMA which is one more sign of trend reversal. Another confirmation will come when 50 will cross 200. Due to Negative Divergence, price may halt at the present level. Bulls are strongly guarding 560 Put strike with a huge position and they have also built very good position at 600 Put strike. Bears are sitting firmly at 640 Call strike. If at all price corrects towards 200 DMA (571), one may like to buy the scrip with a small SL.

GlenmarkPharma industry is showing meaningful signs of reversal. Glenmark chart is worth studying for investment. Coming up from the lows and reached above 200 DMA. Now: a) 605 is a strong resistance, so some correction may be coming, b) 50 DMA is about to cross 100 DMA on the upside. So if correction comes one may like to buy for long term. 50 crossing 100 will take the price towards 700 plus.


GLENMARK Next Move(Mid Term Opportunity)RSI Depicting oversold conditions. strong support at ~520.
approaching crossover on a weekly scale. Strong Signs of an upcoming Bull run.
Take Profits:
640
730
900
1045


GLENMARK SELL SETUP BASED ON RESISTANCE LEVELSTOCK TOUCHED ITS RESISTANCE LINE AND REJECT FROM THERE, RSI ALSO SHOWING BEARISH VIEW SO ITS TIME TO SELL DIS STOCK.ENTRY STOP LOSS AND TARGET ON CHART.
IF YOU AGREE WITH MY VIEW THEN PLEASE HIT LIKE I REALLY APPRECIATE THAT.
TRADE WITH CARE.
REGARDS
KING999
