GMDC, Long 1D, Breakout, VolumesGMDC has shown a good volume in the stock today and has taken support from the previous low. If it breaks its recent high of 428 with Bullish candlestick patterns like Bullish Engulfing, Hammer & Inverted Hammer, Piercing Line, Morning Star, Three White Soldiers, Tweezer Bottoms or Bullish Harami, then take a long trade on this stock.
Entry: 428 (on Bullish candlestick pattern)
Target1: 445
Target2: 450 till 480.
GMDCLTD trade ideas

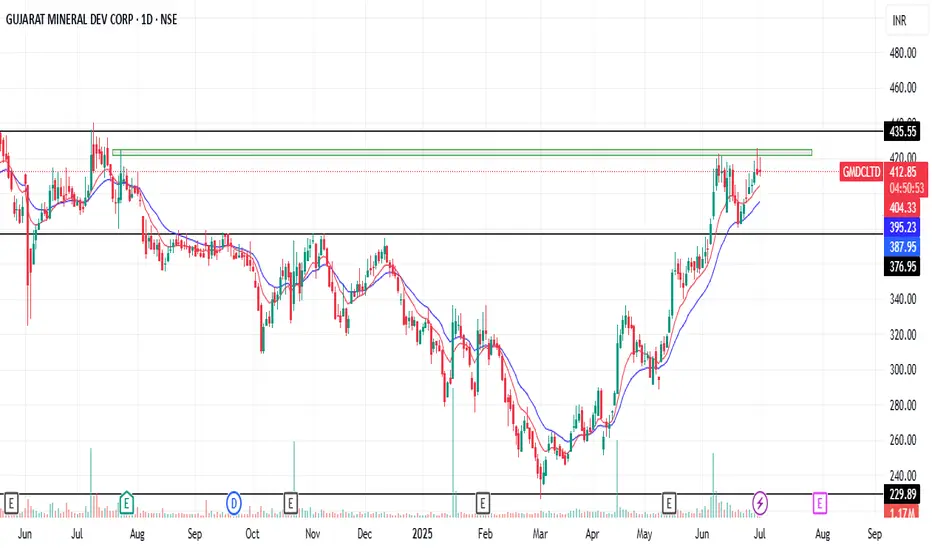
GMDC Inside Bar Strategy Entry 443
SL 422
RSI above 60 Daily / Weekly / Monthly
W Pattern formed
Volume Growth

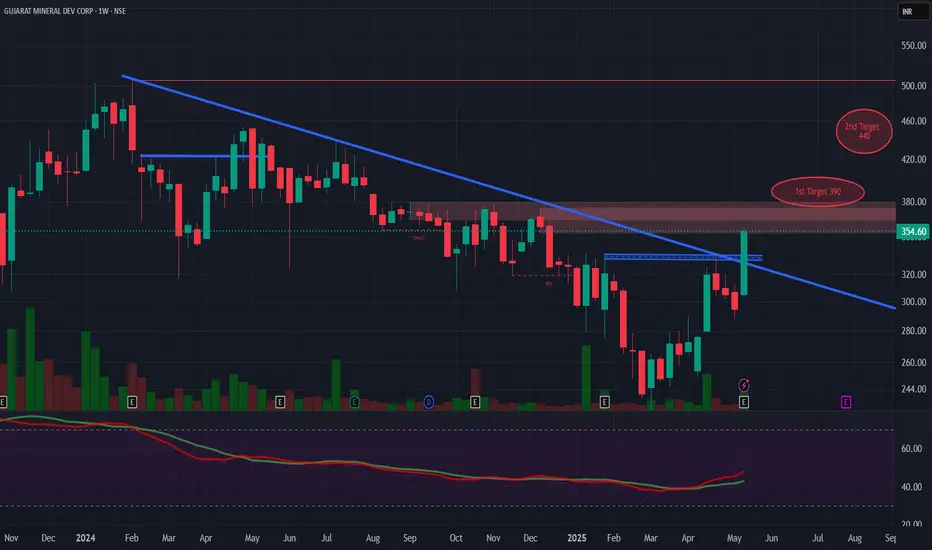
Cup & Handle and Trendline Breakout - GMDC LTDTechnical Analysis:
Current Price: ₹354 (Note: Live prices can fluctuate. As of the latest information available, GMDCLTD closed around ₹349.95 on May 16, 2025).
Targets: Your targets of ₹390 and ₹440 suggest a potential significant upside.
Cup & Handle Pattern Breakout: This is a bullish continuation pattern, and a breakout suggests a potential move higher.
Trendline Breakout: Breaking above a significant trendline also indicates potential bullish momentum.
Time Frame: A 1 to 3-month timeframe is a reasonable expectation for these patterns to play out, assuming the breakouts are sustained.
Confirming the Breakouts:
Volume: It's crucial to assess if the breakouts were accompanied by a noticeable increase in trading volume. Strong volume adds conviction to the validity of the breakouts.
Sustainability: Monitor if the price holds above the breakout levels in the coming trading sessions.
Potential Upside:
Target 1 (₹390): Represents an approximate 10.29% upside from the ₹354 level (or around 11.44% from the ₹349.95 closing price).
Target 2 (₹440): Represents a more significant potential upside of around 24.29% from ₹354 (or about 25.73% from ₹349.95).
Quarterly and Yearly Results & EPS Comparison:
Based on the available information (primarily data up to December 2024):
Latest Quarter Result (December 2024): GMDCLTD reported a rise of 26.39% in consolidated net profit. Sales also increased by 15.80% to ₹653.42 crore.
EPS (TTM - Trailing Twelve Months): The EPS for the trailing twelve months is around ₹20.97 (as per some sources).
To provide a more precise comparison of quarterly and yearly EPS, we would need the specific figures for the most recent quarters and the full financial year ending March 2025, which the company is expected to announce.
Key Factors to Monitor:
Breakout Confirmation: Watch for sustained price action above the breakout levels with good volume.
Upcoming Results: Keep an eye on the full-year results and any further quarterly results announcements, as these can significantly impact the stock price. The board meeting to consider these was held on May 15, 2025.
Sector Performance: The performance of the mining and minerals sector can also influence GMDCLTD.
Technical Indicators: Using other technical indicators like RSI and MACD can help confirm the bullish momentum.

GMDC , 1WPattern is Looking very Great and is Ready to Breakout ,
if it broke the upper trendline with Good Volume then we can consider it is the best breakout
Follow for more Swing Ideas Like this

GMDC - LONGNSE:GMDCLTD Weekly chart and macd setup both looking extreme bullish for med to long term.

Review and plan for 2nd April 2025Nifty future and banknifty future analysis and intraday plan in kannada.
Few stocks too.
This video is for information/education purpose only. you are 100% responsible for any actions you take by reading/viewing this post.
please consult your financial advisor before taking any action.
----Vinaykumar hiremath, CMT

GMDCLTDprice is traded at support area so it s possible chance that price will move upper side
after breaking of trendline entry will be possible
This idea is for Educational purpose and paper trading only. Please consult your financial advisor before investing or making any position. Facts or Data given above may be slightly incorrect. We are not SEBI registered.

GMDC---AccumulateWe might have corrected in 4th wave and inverse head and shoulder in making once crosses 378 will show immense power and target of 478 as per breakout

GMDC BUYNSE:GMDCLTD Weekly parabolic formation on chart with buyers will create positive price breakout in near future. macd also giving buying signal , that is the clear cut indication of force.

GMDCLTDHi guys,
In this chart i Found a Demand Zone in GMDCLTD CHART for Positional entry,
Observed these Levels based on price action and Demand & Supply.
*Don't Take any trades based on this Picture.
... because this chart is for educational purpose only not for Buy or Sell Recommendation..
Thank you
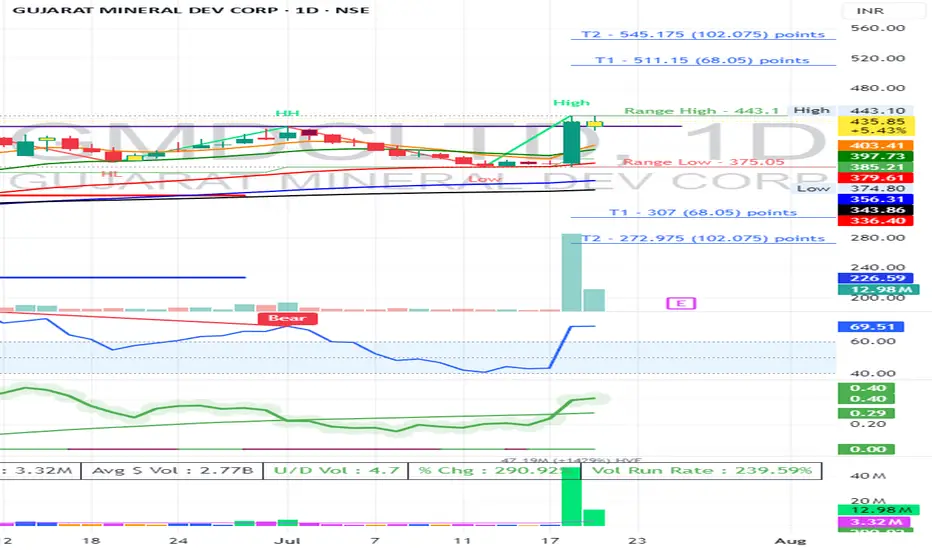
GMDCLTD S/RSupport and Resistance Levels:
Support Levels: These are price points (green line/shade) where a downward trend may be halted due to a concentration of buying interest. Imagine them as a safety net where buyers step in, preventing further decline.
Resistance Levels: Conversely, resistance levels (red line/shade) are where upward trends might stall due to increased selling interest. They act like a ceiling where sellers come in to push prices down.
Breakouts:
Bullish Breakout: When the price moves above resistance, it often indicates strong buying interest and the potential for a continued uptrend. Traders may view this as a signal to buy or hold.
Bearish Breakout: When the price falls below support, it can signal strong selling interest and the potential for a continued downtrend. Traders might see this as a cue to sell or avoid buying.
20 EMA (Exponential Moving Average):
Above 20 EMA(50 EMA): If the stock price is above the 20 EMA, it suggests a potential uptrend or bullish momentum.
Below 20 EMA: If the stock price is below the 20 EMA, it indicates a potential downtrend or bearish momentum.
Trendline: A trendline is a straight line drawn on a chart to represent the general direction of a data point set.
Uptrend Line: Drawn by connecting the lows in an upward trend. Indicates that the price is moving higher over time. Acts as a support level, where prices tend to bounce upward.
Downtrend Line: Drawn by connecting the highs in a downward trend. Indicates that the price is moving lower over time. It acts as a resistance level, where prices tend to drop.
RSI: RSI readings greater than the 70 level are overbought territory, and RSI readings lower than the 30 level are considered oversold territory.
Combining RSI with Support and Resistance:
Support Level: This is a price level where a stock tends to find buying interest, preventing it from falling further. If RSI is showing an oversold condition (below 30) and the price is near or at a strong support level, it could be a good buy signal.
Resistance Level: This is a price level where a stock tends to find selling interest, preventing it from rising further. If RSI is showing an overbought condition (above 70) and the price is near or at a strong resistance level, it could be a signal to sell or short the asset.

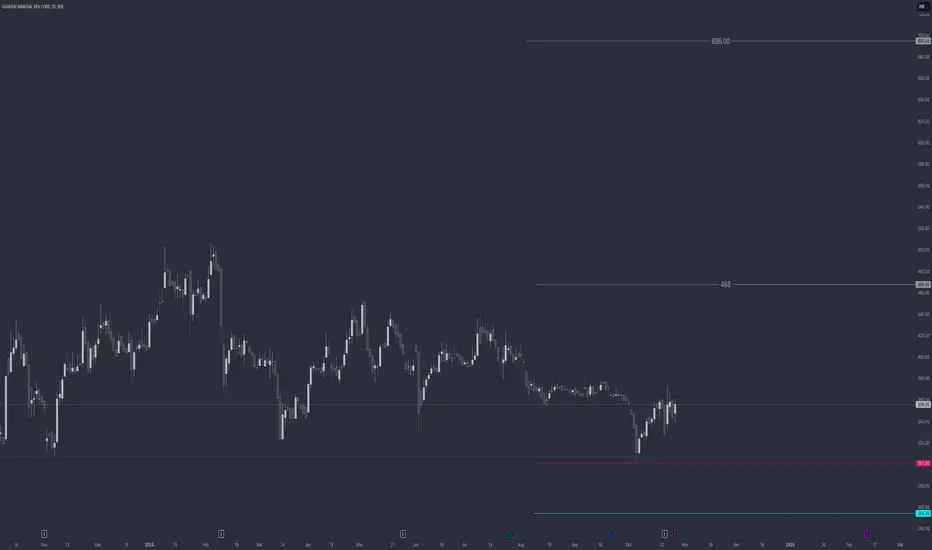
GMDC--RARE EARTH COMPANYAfter completing the third wave, the stock has formed patterns A, B, C, D, and E in the fourth wave and now appears poised for the fifth wave, with a price target of 540-580. Fundamentally, the company is a strong bonus candidate and is unique in having allocated three mines for rare earth exploration. The company boasts a dividend yield of 2.77%, a book value of 192, and negligible debt.

GMDC--A rare earth metal stockMonday important will it break or pull back.. corrective rally in progress and to end soon. Once correction is over you will see fast rise in 1st wave of 5th. At important juncture. We have a target of 540-550 .As cash rich and bonus candidate stock.

GMDC--LONGWe are near to bottom position can be taken here for a target of 396-400 in 1st of 5th wave . Every dip is a buy. company which is fundamentally strong, bonus candidate ,good dividend yield and more over company is deploying cash in its book for rare earth exploration and mine development 5th wave target of 540-550 every dip is a buy in this stock.

GMDC--BUY the dipconsolidating in 4th wave A,B,C,D,E formation in wave 4th completing dividend of Rs 9.55 in stock , 5th wave to begin soon .Accumulate for Steller return in coming days likely target of 525-40 rs.


GMDCTrendline breakout with volumes
Next target 452 - 480 -500
above 500 we have to do a review again.
Disclaimer: only for education purposes, no buy or sell recommendation. we are not sebi registered. always discuss first with your financial advisors

GMDCBO from 6 months trendline. wait for a strong close with good volumes above the trendline. DO your own research before entering any trade. Pls boost the post if this idea helps you. Thank you.

GMDC-buy on dipin contracting triangle soon to breakout metal policy/ auction of mines for lithium mining on the cards major govt companies in fray are GMDC, MOIL and NALCO. Wave 3rd of 5th to begin soon , accumulate on every dip.

GMDC-STRONG BUY taking support at 385 the share looks promising. In 5(3rd) after completing 5(2) .9.55 rs dividend low 385 high expected 418- 20 if crosses 422 then trg 440 -47 , bonus candidate and can get lithium mining with Moil .Metals in uptrend last unmove going. Can cross 500 once good news comes in , company is having good book value conducive for bonus. And aluminum/ iron prices are in upwing from 1st March hence expecting good qtr in June24 ending. And bonus till sept 24 .
