HAL consolidation BreakoutHAL has been testing the 1500 levels from last 7 months. It is a good long trade if it closes above 1500 today since it has never given a daily closing above it.
It is a breakout from inverted head and shoulders pattern and target can be 15-20% positionally.
Stoploss can be below 1410 DCB.
Just for educational purpose.
HAL trade ideas

HALNSE:HAL
Note :
1.One Can Go long with a Strict SL below the Trendline or Swing Low of Daily Candle.
2. Close, should be good and Clean.
3. R:R ratio should be 1 :2 minimum
4. Plan as per your RISK appetite
Disclaimer : You are responsible for your Profits and loss, Shared for Educational purpose!

HAL cup handle pattern breakout HAL was made a breakout of its cup handle pattern
Buy HAL at 2684
Target 2763 2815 2900 3000
Sl 2520

HINDUSTAN AERONAUTICS (HAL)The idea is based on the Elliott Wave Theory. The current price seems to be corrective in structure which suggests another wave Y could unfold driving prices to the previous levels or lower.

Trendline & Resistance BreakoutPlease look into the chart for a detailed understanding.
Consider these for short-term & swing trades with 2% profit.
For BTST trades consider booking target for 1% - 2%
For long-term trades look out for resistance drawn above closing.
Please consider these ideas for educational purpose

HAL Buy for intraday tradingHAL Buy for intraday trading if stock breaks the given resistance level.........
HAL- Hindustan Aeronautics - Weak structure NSE:HAL Looks very weak in all higher time frames.
1] At Monthly time frame it is a clear Bearish engulfing pattern.
2] At Weekly time frame it is having a head and shoulder pattern.
3] At Daily time frame it is clearly completed a head and shoulder pattern. The volumes are dried during the phase of H&S and started to pick heavily during down days.
4] Neckline is placed at 2300 a clear break down with heavy volume is a must for a Short entry or retest with low volume to neck line after a break down is another low risk entry opportunity.
5] Usually the targets in such pattern is the difference to neckline, in this case it 420 points or 1900. Interestingly the NSE:HAL chart has meaning full support only at 1900.
Good Luck

HALTaking support from long term trendline. Expected to give good bounce from trendline.
Can add at CMP or any dip for a target of 3000-3200 with sl of 2300
Fundamentally good company.

HINDUSTAN AERONAUTICS LIMITEDHindustan Aeronautics Limited trading in an uptrend movement on a daily time frame.
It took a support from Fibonacci Golden Reversal Zone, With a Bullish Engulfing Candlestick (bullish reversal candlestick).
Which indicates the entry of major buyers in the stock and indicates the starting of a new primary trend.
Market is expected to remain bullish for few upcoming trading sessions. And may test the levels of 2800 on higher side.
On downside level of 2400 remains the major support level in the market.

HAL Crucial ZoneRed boxes keep the price down, whereas blue and Green one's keep the price up. For price to resume uptrend, the immediate red box must be broken for scenario 1 to prevail else scenario 2.

HAL - NeutralHAL has reversed trend on 15 min time interval wait for 2475 to cross and sustain at that level on for 15-20 min before takin trade on long side for a TGT of 2500.


Hal breakoutHal breakout and retest
Hal breakout with good volume
both price action and our our indicator setup on bull move
volume and trend setup for additional confirmation
all levels share here for educational purpose.we are not sebi registered

HALPrevious uptrend
Cup breakout
Above average volume
Elliot oscillator green
Stochastic bar > 80 with black bar on top
Due to very long bar on 16 November i prefer to wait.

HAL- Double Breakout HAL has broken channel resistance and all time high point resistance in single day. Looks more bullish. Trade with SL and Trail your SL for good-RRR.

BREAKOUT STOCK HAL buying trend continues HAL has given a break out from its range bound zone
expecting further upmove as it has given a breakout and buying happened with Good volumes.

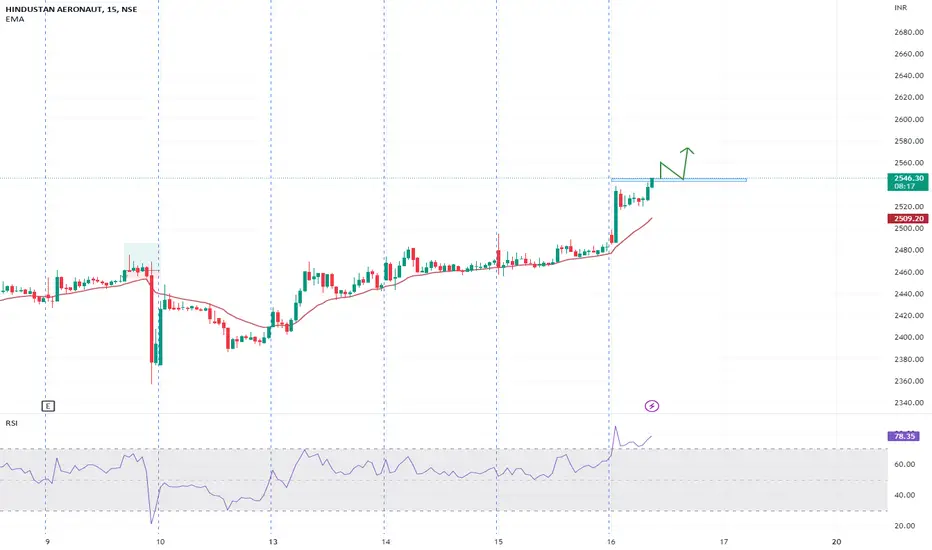
HAL - MoneyMakerHAL is on the verge of breaking out of ascending triangle, also at an level which got rejected 7 times in last 30 trading sessions, if it breaks above 2530 & sustains even for a minute then it ll skyrocket in no time.
Best thing about this trade is very good Risk:Reward Ratio.
Even if it opens gap up of 10-15 points buy without any hesistation with mentioned stoploss & target.


HALHAL broke above triangle on hourly chart but couldnt sustain above breakout as overall market is weak, its still a buy as its trading above yesterday's low.
So, buy HAL here @ 2475 or on dip till 2455-2460 with mentioned stoploss & target.

HAL Parallel channel exitAdded Parallel channel for HAL Weekly channel. Keep a tab for exits from here

HAL- 60 MINS TIMEFRAMEThe Structure looks good to us, waiting for this instrument to correct and then give us these opportunities as shown on this instrument (Price Chart).
Note: its my view only and its for educational purpose only. only who has got knowledge about this strategy, will understand what to be done on this setup. its purely based on my technical analysis only (strategies). we don't focus on the short term moves, we look for only for Bullish or Bearish Impulsive moves on the setups after a good price action is formed as per the strategy. we never get into corrective moves. because it will test our patience and also it will be a bullish or a bearish trap. and try trade the big moves.
we do not get into bullish or bearish traps. we anticipate and get into only big bullish or bearish moves (Impulsive Moves).
Just ride the Bullish or Bearish Impulsive Move. Learn & Know the Complete Market Cycle.
buy low and sell high concept. buy at cheaper price and sell at expensive price.
Keep it simple, keep it Unique.
please keep your comments useful & respectful.
Thanks for your support....
Tradelikemee Academy

#HALHAL buy above 2260
SL 2200
Target 2360++
Technically good set up.. looking for higher targets.
Caan hold for swing trade
