HAPPSTMNDSHAPPSTMNDS
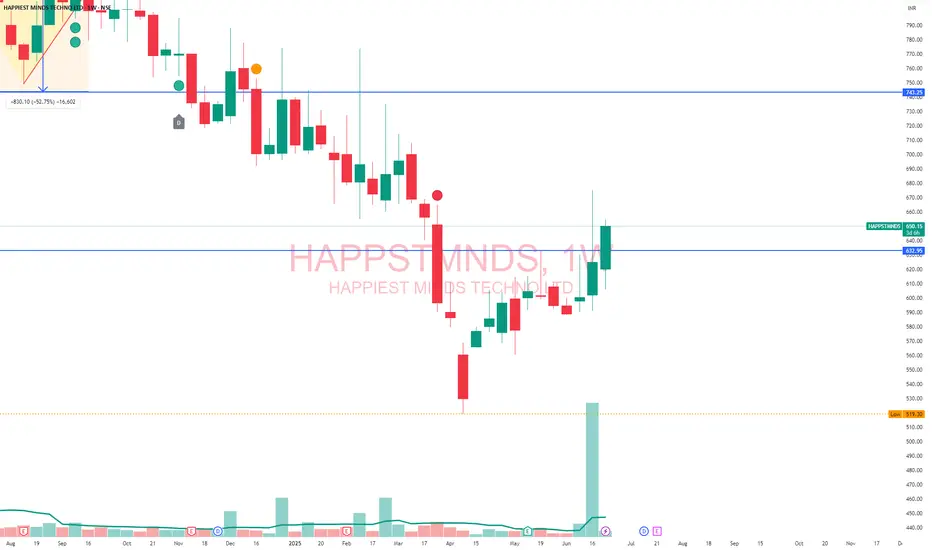
Happiest Mind is look good for long position, Current Price is 650...
This stock has been having bearish fight since a long time.. now ready for blast..
Target: 700, 750, 800
Time Frame: Few Weeks.
HAPPSTMNDS trade ideas
Happiest Mind towards 333? - Pennant BreakdownHappiest mind has shown pennant Break down on weekly time frame.
It will have potential down side as below,
610 - 500 - 400 - 333

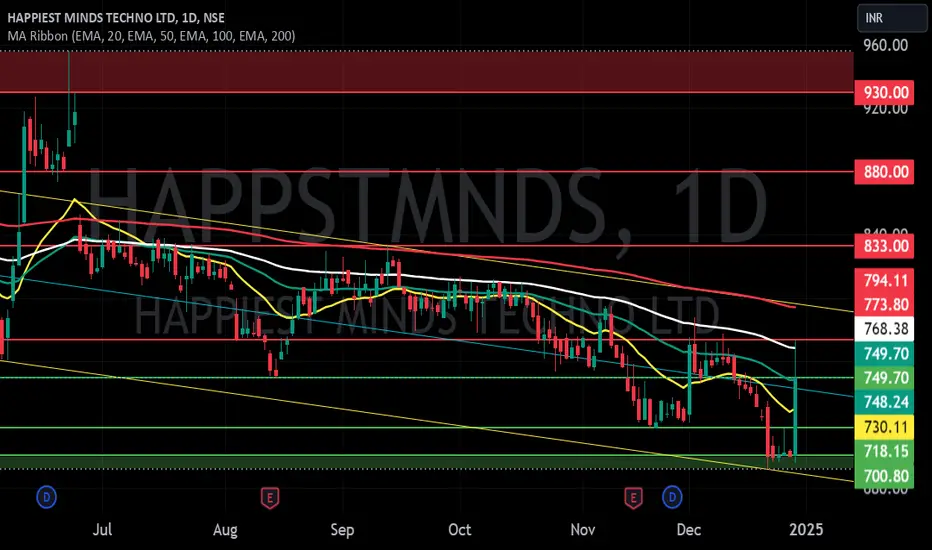
HAPPIEST MINDS TECHNO S/RSupport and Resistance Levels:
Support Levels: These are price points (green line/shade) where a downward trend may be halted due to a concentration of buying interest. Imagine them as a safety net where buyers step in, preventing further decline.
Resistance Levels: Conversely, resistance levels (red line/shade) are where upward trends might stall due to increased selling interest. They act like a ceiling where sellers come in to push prices down.
Breakouts:
Bullish Breakout: When the price moves above resistance, it often indicates strong buying interest and the potential for a continued uptrend. Traders may view this as a signal to buy or hold.
Bearish Breakout: When the price falls below support, it can signal strong selling interest and the potential for a continued downtrend. Traders might see this as a cue to sell or avoid buying.
MA Ribbon (EMA 20, EMA 50, EMA 100, EMA 200) :
Above EMA: If the stock price is above the EMA, it suggests a potential uptrend or bullish momentum.
Below EMA: If the stock price is below the EMA, it indicates a potential downtrend or bearish momentum.
Trendline: A trendline is a straight line drawn on a chart to represent the general direction of a data point set.
Uptrend Line: Drawn by connecting the lows in an upward trend. Indicates that the price is moving higher over time. Acts as a support level, where prices tend to bounce upward.
Downtrend Line: Drawn by connecting the highs in a downward trend. Indicates that the price is moving lower over time. It acts as a resistance level, where prices tend to drop.
Disclaimer:
I am not a SEBI registered. The information provided here is for learning purposes only and should not be interpreted as financial advice. Consider the broader market context and consult with a qualified financial advisor before making investment decisions.
HAPPIEST MINDS - Breakdown !! The chart is self-explanatory as always.
The price has followed the textbook price action of Breakdown, Retest and continuation.
750 acted as a support previously, Once it was broken, It was retested and failed to cross over.
The price has now given a breakdown of the wedge pattern.
It will be interesting to watch if it reverses from here trapping sellers. Or continues its journey downwards towards 600 - 650 levels.
The question is, Will it bounce back??
Disclaimer: This analysis is purely for educational purposes and does not constitute trading advice. I am not a SEBI-registered advisor, and trading involves significant risk. Please consult with a financial advisor before making any investment decisions.

HAPPIEST MINDS ANALYSISLong term Stock
Consolidation for long time , large cap stock
Can be entered between 750 - 800 , any market correction then can be added at 600
Target 1000 and 1600
Disclaimer : It's not a buy/sell recommendation. Posts/views are only for educational purpose.

Happiest Minds Trend AnalysisOne of the most complex corrections came to an end.
It has formed WXY double corrective pattern where W is ABC Zigzag & Y is ABCDE triangle.
Entire correction lasted for more than 3 years & 3 months but in that duration company has shown revenue growth and they have increased their employees as they are expanding globally in the field of disruptive innovation.
Net profit got affected due to margin pressure (increase in employee cost).
Debt is little concerning, rest all parameters are ok.
On a broader view, waves 1 & 2 have ended and price is at the initiation of wave 3.
Wave 3 targets can be huge. Will share the targets later.
Do your own due diligence before taking any action.
Peace!!

happiest minds about to blow in upward directionhappiest minds is an it industry company which has a strong balance sheet. the current chart shouting out loud come buy me as I am forming a triangle pattern with strong base form. the chart shows key price level. chart is self explanatory. please it is not a buy recommendation only chart analysis use your own rational before investing . Thank yoy

Looking extremely enticing for 1185Accumulate for a target of 1180 and beyond. Happiest minds has consolidated a lot and now is bottoming out.

$happstmndsinteresting point here
another 3hrs for H4 close
just above us is the daily 200 ema so reclaim this i would be leaning towards a reclaim of horizontal resistance and 200 on the daily
time to load up imo

HAPPIEST MINDS READY FOR BREAKOUT...NSE:HAPPSTMNDS trade at 816 level. Stock trade in a triangle range since last 2 years and take multiple ssupport between at 730-780 level. Now stock seen a reversal sign, So you can watch for at 1100 level...

Happiest Mind - chart looks good for long term Happiest Mind - chart looks good for long term.
Promoters Majority shareholders, Held in 15.00 Mutual Funds Schemes (1.32%), Held by 108 FIIs (4.69%), Individual Investors Holdings is 32.45%

Happiest Minds: Happy days are here again? 🤩Hello There, Welcome back! 👋
Here is all you need to know about Happiest Minds:
• The stock price has been range-bound in a downward Wedge pattern for over 14 months.
• An attempt to break the pattern resulted in a long upper-wick candle, suggesting sellers' presence.
• A subsequent inside candle gave a weak breakout, after which the price has been consolidating/retesting.
• The psychological level of 1000 has acted as a strong resistance.
• Despite crossing the 1000 level weekly for the past 3 weeks, the price has failed to close above it.
• A close and sustenance over the 1030 level would be absolutely necessary for it to continue its upward momentum
• The next immediate resistance seems to be around 1175.
• Another important thing to note is that it recently raised 500 Crs via QIP @ 924/Share. That is what triggered the 6% fall a day ago.
• Help us reach many like-minded investors like You! Would you give us a Boost for motivation?
• Investors included Troo Capital, Société Générale, BNP Paribas Arbitrage ODI, BofA Securities Europe SA -ODI and Morgan Stanley Asia (Singapore). Given that these are funds and not corporates, The sole motto seems to be capital appreciation which is a positive.
• The Indian IT sector too is approaching its critical resistance for the third time.
Which company should we analyze next? 👇
Thoughts or Questions? Let us know in the comments below.👇
⚠️Disclaimer: We are not registered advisors. The views expressed here are merely personal opinions. Irrespective of the language used, Nothing mentioned here should be considered as advice or recommendation. Please consult with your financial advisors before making any investment decisions. Like everybody else, we too can be wrong at times ✌🏻

Bullish educational View on HAPPSTMNDSBullish View on HAPPSTMNDS:
Upcoming footprint chart analysis suggests a strong bullish trend in #HAPPSTMNDS, with a potential short-term target of ₹1177. The current price of ₹882 offers a promising entry point lower level in green highlighted, and i believe that the stock has the potential to surge higher in the coming future.
Key Observations:
The stock has formed a solid base around the ₹800-850 zone, which we believe is a strong support level. Any retracement to this zone would provide an attractive entry point for long-term investors.
The recent price action has formed a higher low, indicating a strong buying interest in the stock.
The long-term trend is firmly bullish, with the stock trading above its 50-day and 200-day moving averages.
The Relative Strength Index (RSI) is currently around 60, indicating that the stock is not overheated and has room for further upside.
Chart Projection:
Our chart analysis suggests that if the stock can sustain above the ₹882 level, it could potentially reach our short-term target of ₹1177. This target is derived from the measurement of the recent upswing, and we believe that the stock has the potential to reach this level in the coming future.
Entry Strategy:
its best way to accumulating the stock on any retracement to the ₹800-850 zone. This zone offers a strong support level, and any dip to this level would provide an attractive entry point for long-term investors. For traders, a buy stop-lossas per capital risk current CMP ₹882 could be an attractive entry point ₹800-850 zone, with a target of ₹1177/ 2000.
Risk Management:
As with any investment, there are risks involved. We recommend maintaining a stop-loss of as per your capitals on any long positions, and trailing it higher as the stock moves in our favor.
In conclusion, our footprint chart analysis suggests a strong bullish trend in HAPPSTMNDS, with a potential short-term target of ₹1177. i believe that the stock has the potential to surge higher in the coming future.
Disclaimer: This analysis is for educational purposes only and does not constitute any recommendations. The information provided here is based on my interpretation of the data and should not be considered as financial advice. Any positions taken based on this analysis should be done in consultation with a personal financial advisor. Trading and investing in the stock market involves risks, and it is important to understand those risks before making any decisions.

HAPPSTMNDSHi guys, In this chart i Found a Demand Zone in HAPPSTMNDS CHART for Positional entry,
Observed these Levels based on price action and Demand & Supply.
*Don't Take any trades based on this Picture.
... because this chart is for educational purpose only not for Buy or Sell Recommendation..
Thank you

HAPPIEST MINDSA Clear indication of how Happiest mind is technically underperforming on chart compared to Nifty index itself because we have both short and long RS below 0 line. Once we expect a good turnaround of NIFTY-IT, keep this stock in watchlist. Wait for a clear Trend change indication. Need the Falling wedge Weekly breakout with Good Volume along with Breakout of previous swing high. During breakout, one of the RS be above 0 line. RSI > 60, EMA 10>20>50>200 rising. Positional trade till the ATH level can be expected after the Breakout

Charts Says everything....Happiest Mind Technonologies seems to be closing its doors for bears...!
Here is presented an Elliott Wave Analysis of the above stock.
Incorporated in 2011, Happiest Minds Technologies Ltd is a next generation IT solutions & services Company. Company offers IPs and domain expertise across a set of focused areas that include Digital Transformation & Enterprise Solutions, Product Engineering, Infrastructure Management, Security, Testing and Consulting. In the Solution space, focus areas are Security, M2M and Mobility solutions. Additionally, company is an authorized partner with global information technology players to deploy their services and create custom solutions.
Disclaimer : I am not a registered analyst with the Securities and Exchange Board of India (SEBI) or any other regulatory authority. The information provided here is for educational and informational purposes only and should not be considered as financial advice. Any investment decisions you make should be based on your own research and consultation with a qualified financial advisor. It is important to note that investing in securities involves risks, and past performance is not indicative of future results. I strongly recommend consulting with a licensed financial professional before making any investment decisions. I do not accept any liability for any loss or damage incurred as a result of reliance on the information provided in this communication. Always conduct your own due diligence and seek professional advice before making any investment decisions.

Happiest mindHappiest mind looking good for swing. If it breaks green high and sustains 15 min. It is inside the strong order block zone. Keep an eye on it.

Happiest MindHappiest mind gave a reversal till last order block. If a green candle forms touching the zone then a strong up movement can be seen if its high breaks.

Happiest minds: End of sadness?A close above 956 will be a sign if Inverted HnS breakout, a more certain BO with less risk can be seen above 970. This may lead scip to 1130 in next few weeks.

Happiest Minds (NSE: HAPPSTMNDS) // Going Bullishwww.tradingview.com
HAPPSTMNDS : After a great fall and making 52w low, this is currently trying to exit from consolidation phase. One can look for medium to long term buy by keeping the StopLoss at 890, the first target can be 960 and then the next target will be 1015 and then 1120. These are immediate targets. The final target will be 1490. One can start with low volume and gradully keep increasing that.

Happiest Minds Technologies Ltd
TARGETS MENTIONED IN CHART
SL 2 %
FUNDAMENTALS
Market Cap
₹ 14,047 Cr.
Current Price
₹ 922
High / Low
₹ 1,023 / 763
Stock P/E
63.7
Book Value
₹ 90.4
Dividend Yield
0.59 %
ROCE
27.4 %
ROE
28.9 %
Face Value
₹ 2.00
Promoter holding
51.4 %
EPS last year
₹ 14.7
EPS latest quarter
₹ 3.58
Debt
₹ 539 Cr.
Pledged percentage
7.01 %
Net CF
₹ -67.5 Cr.
Price to Cash Flow
81.8
Free Cash Flow
₹ 36.7 Cr.
Debt to equity
0.39
OPM last year
24.1 %
OPM 5Year
20.7 %
Reserves
₹ 1,348 Cr.
Price to book value
10.2
Int Coverage
9.28
PEG Ratio
1.01
Price to Sales
9.93
Sales growth 3Years
24.0 %
Return on assets
16.3 %

Get ready to Stand-up and Salute the Flag - Happiest MindsHappiest Minds is a Leader in digital transformation IT consulting & services company focusing on Big Data, Analytics Cloud, Mobility & Security for better business development.
After the IPO in Sep 2020 the stock saw a Dream Run in less than 1 year to reach a Skyhigh milestone of 1600 from a mere 300 / stock. After this its been in a consolidation mode for nearly 2+ years forming a Standout Flag Pole pattern on Monthly
Here are the Technicals behind the Amazing Bull Run Setup:
Monthly: Flag Pole BO above 960 for Target of 1600++
Weekly: There are 2 Cup and Handle patterns. One with a Cup and Parallel Channel Handle and other with a Cup and Inv H&S inside the Handle.
The completion of INv H&S pattern will enable BO of the Flag pattern to take the stock sky high again
Disclaimer:
3+ Years Teaching Experience in Stock Market - Technical Analysis, Advanced Patterns, Emotional Management, News based Trading...
We are NOT SEBI Registered
Our focus is NOT providing Buy/Sell Recommendations/calls
Primary Objective is to provide detailed analysis of how to review a chart, explain multi--timeframe views purely for Educational Purposes.
We strongly suggest our followers to "Learn to Ride the Tide irrespective of its Side"
*** Important *** Consult your Financial Advisors before taking any positions
If you like our detailed analysis, please do rate us with your Likes, Boost and share your comments
-Team Stocks-n-Trends

Long Happiest mindThis for me is the biggest AI play in indian stock market.
I have been waiting for a technical set up for over 3 months.
Today went long @875.00
SL@ 857, 2 percent down , but if it breaks back below 875 and sustains it on daily , close trade
Target price between 960 to 970
