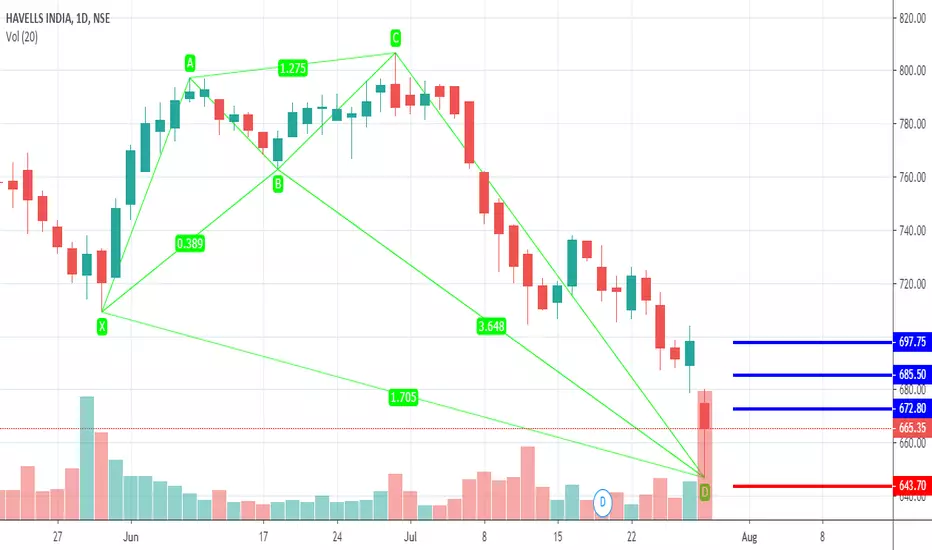
PRZ 647-650 AWAITEDDISCLAIMER :
As a trader you should consider your own risk:reward ratio and do proper lot sizing according to your margin and leverage level.
Not every idea is a valid trade.
This analysis is a trading idea, not a trading signal for you.
My own trend direction estimation, entry point, stop loss and take profit levels are on the chart.
Good Lucks.
HAVELLS trade ideas


stockhavells had a triangular pattern breakout prices likely to faces resistance near 500 ema . traders if u like my work please press like.


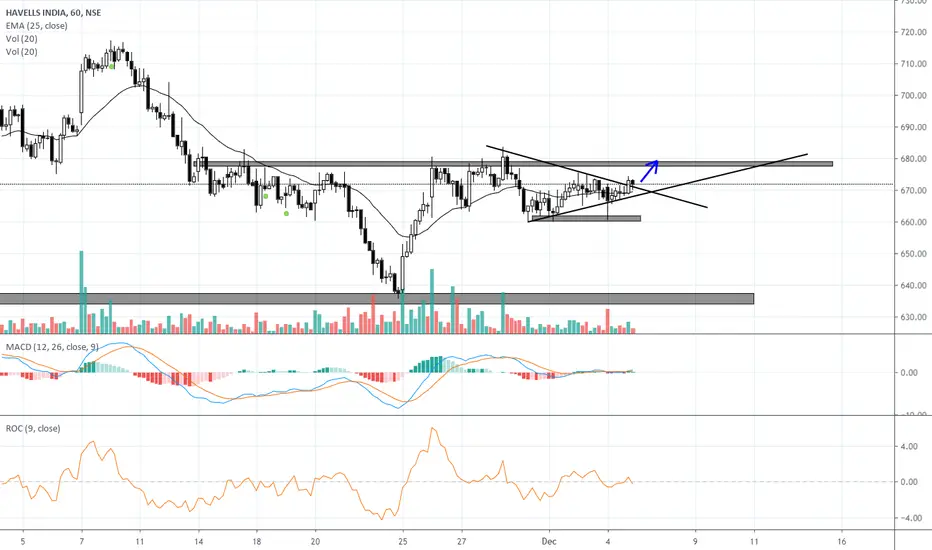


HAVELLS INDIA- Hourly chart showing weakness Hourly chart of Havells India is showing weakness if its break 660 level (Triangle breakdown) or eventually 652 level ( Short term support level) then chart will show downside. 630 will be 1st level to watch and if its break 630 then 590 will be 2nd level to watch.


Havells - Long1) Weekly Parallel Channel
2) Weekly - 100 EMA support
3) Buy zone - 590-640 SL, weekly close below 590

Havells - Long1) Buy zone - 640-590
2) SL - 590 Weekly CLBS
3) Parallel Channel - Weekly
4) Support - 100 EMA Weekly


Havells As the results are coming in of Havells we can see a rise from here as the total profit after tax is expected to be somewhat near to 246 which is the rise from the last result .....as the market is overall down bears are having a hard to convert in bulls fear is prevailing in the market ....as I think the stock is in perfect position to buy here. buy tomorrow and sell on Monday
