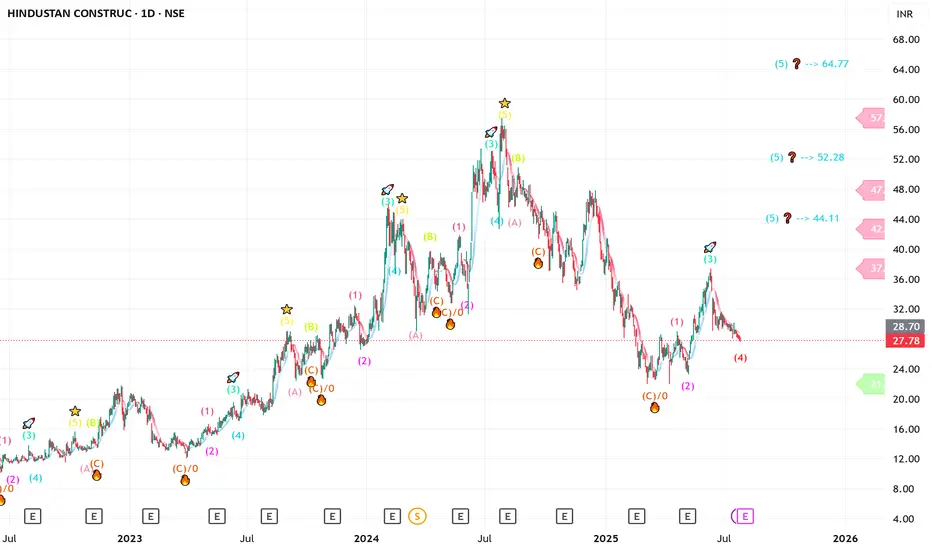
HCC - can give you 100 % or more ?? long term only HCC ----Daily counts indicate Excellent bullish wave structure.
Both appear to be optimistic and this stock invalidation number (S L) wave 2 low
target short / long term are already shared as per charts
correction wave leg seems completed (C)
ENTRY zone 24 & 19
Investing in declines is a smart move for short/ long-term players.
Buy in DIPS recommended
Long-term investors prepare for strong returns over the next two to five years.
one of best counter
Every graphic used to comprehend & LEARN & understand the theory of Elliot waves, Harmonic waves, Gann Theory, and Time theory
Every chart is for educational purposes.
We have no accountability for your profit or loss.
HCC trade ideas
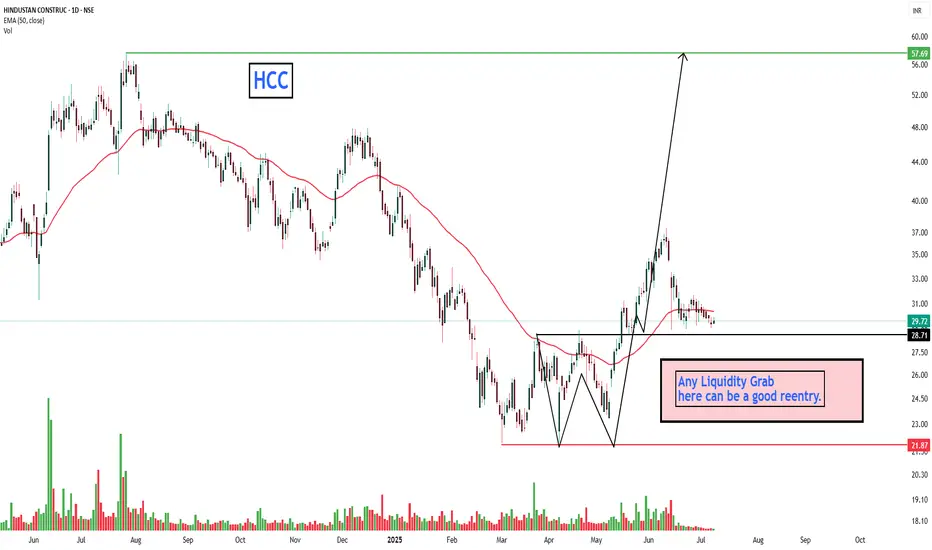
HCC LOOKING - COULD BE A GOOD ENTRYEverything is pretty much explained in the picture itself.
I am Abhishek Srivastava | SEBI-Certified Research and Equity Derivative Analyst from Delhi with 4+ years of experience.
I focus on simplifying equity markets through technical analysis. On Trading View, I share easy-to-understand insights to help traders and investors make better decisions.
Kindly check my older shared stock results on my profile to make a firm decision to invest in this.
Kindly dm for further assistance it is for free just for this stock.
Thank you and invest wisely.
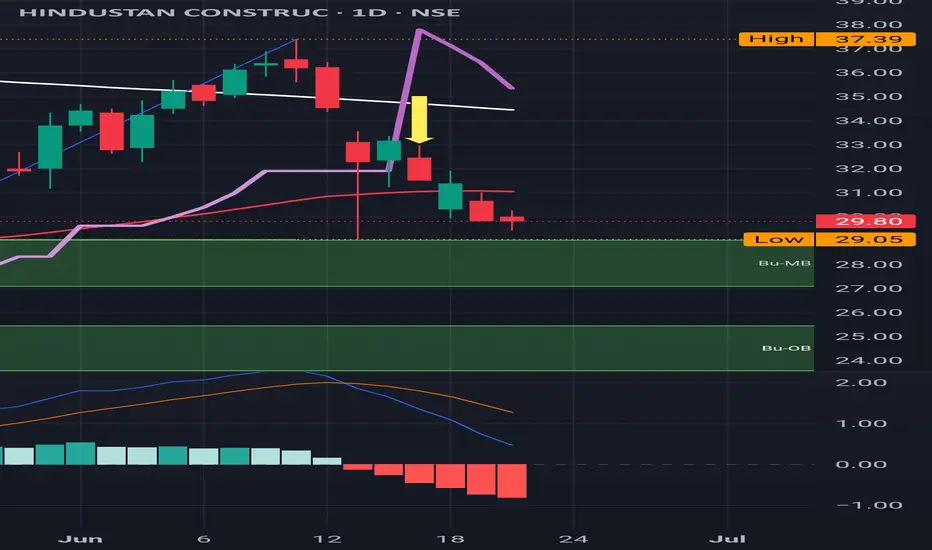
HCC : Downward trend continue after a Sell Signal HCC : Downward trend continue after a Sell Signal .
29 is a nearby Support level to be watched out for .
23 is a major support level which is bit far from the current level.
( Not a Buy / Sell Recommendation
Do your own due diligence ,Market is subject to risks, This is my own view and for learning only .)
HCC Construction: Inching near Red band Resistance HCC Construction: Inching near Red band Resistance
( Not a Buy / Sell Recommendation
Do your own due diligence ,Market is subject to risks, This is my own view and for learning only .)

HCCHCC is on the verge to give triangle breakout provided that it sustains and closes above 31.5. I observed increased market participation. It may face bit of resistance near 36 level and above that it has a potential to go up to 45 levels. But closes below 28.5 may change my view for the stock. Again I'm saying that sustaining above 31.5 is very crucial. Keep a closer watch on how it reacts near this levels.

LET'S CONTRUCT OUR PORTFOLIO HAVING THIS - HCC FOR YOUEverything is pretty much explained in the picture itself.
I am Abhishek Srivastava | SEBI-Certified Research and Equity Derivative Analyst from Delhi with 4+ years of experience.
I focus on simplifying equity markets through technical analysis. On Trading View, I share easy-to-understand insights to help traders and investors make better decisions.
Kindly check my older shared stock results on my profile to make a firm decision to invest in this.
Kindly dm for further assistance it is for free just for this stock.
Thank you and invest wisely.

HINDUSTAN CONSTRUCTION - Entry Initiated as market Reversed.Everything is pretty much explained in the picture itself.
I am Abhishek Srivastava | SEBI-Certified Research and Equity Derivative Analyst from Delhi with 4+ years of experience.
I focus on simplifying equity markets through technical analysis. On Trading View, I share easy-to-understand insights to help traders and investors make better decisions.
Kindly check my older shared stock results on my profile to make a firm decision to invest in this.
For any query kindly dm.
Thank you and invest wisely.

HCC : Available at 50% from ATH looks interestingHCC : Available at 50% from ATH looks interesting .
Entry could be considered in small parts like deploying only 10% and rest later on as the trend continues. It's on a steep downward trend currently and better opportunities could be tapped at the lower prices.
One should keep an eye on this script.
( Not a Buy / Sell Recommendation
Do your own due diligence ,Market is subject to risks, This is my own view and for learning only .)

POV : HCC : It's Time to Ride Again...POV : HCC : It's Time to Ride Again...
My 3rd ride on HCC... Let's Hit the Road
Chart Reading:
1. Took Support at Deep FIB Level
2. RSI and other momentum Indicator indicate Divergence at bottom
3. Trend Line break on 27th Nov
4. Close Above 200 SMA and holding 2 session above
5. Close above the Recent fractal highs or "Double Top" and form today's new HH fractal.
6. The Dashed Blue Line is my old Accumulating Trend Line where I accumulate
7. Volume profile point of Control at around 50~51 so the ground is set for mean reversion to play.
? Expectations :
First POA @ 45, Target : 51,55,61 and Long Term Aim for 81
For educational purposes only. This is not financial advice. Please consult a professional before making financial decisions.
#NiVYAMi

HCC Bullish/Long We need a close above 55 for this long to play out. Once it closes above 55 with good volume, one can take this trade.
First Tp - 100 ish
Final Tp - 500 but that is a long long way time/price wise.
The weekly chart looks good after a mid range retest.. now we need to see a good reaction and a new leg towards the top of the range and beyond.

A multi year breakout and retestA multi year breakout and retest of almost 14 years with significant volumes and strong buying wick resulting in formation of a hammer candle in weekly TF...TGT 82 sl below 37 closing basis....only fir educational purpose and not any recommendation....I am not sebi registered RA

LONG7 YEAR cup handle break out, now retested, likely targets given. Volume buzz seen. Fundamentals improved. This is my study, not a recommendation.

Hcc Share for Swing. 20-30% return possible in short term3 Buying Signal in Hcc Share:
1. Trend : uptrend
2. Level : straight line Support ( previous resistance)
3. Candlestick : Clear Pinbar on support
4. Fibonacci retracement 61-50%
Rs 55-58 Coming soon

HCC Multiyear BreakoutSee in Chart,
HCC multiyear breakout after 2010.
Slow counter..
So it make touch around 70 and 95,
but maybe time period around 6 months and more..
Our post are for Educational Purpose Only.

Take a look at HCCBreaking out of Flag and pole
resting complete after forming classic round bottom
Target could be 56, 62
SL 3%
This is strictly for educational purpose

HCC Upside Breakout LevelsHi,
As per my analysis, here are upside breakout levels of NSE:HCC . Trend is already bullish and positive news also come as per Budget 2024.
Note: This is my personal analysis, only to learn stock market behavior. Kindly do your own analysis/research to take any trade.
Thanks.

LONG HCC...12 yrs Breakout Seat tight on HCC...
Breakout of 12 yrs over ₹40 with big volumes...
Best player in infrastructure segment....
One can Hold for target of ₹70 & New life time high with SL ₹40 or little below
Do you own research and maintain risk reward before investing... It's only for education purpose not any Buy or Sell recommendations...

HCC - swing trade Entry - at 54
SL - 51
Tgt - 57, 63
This is not a recommendation on buy/sell. Please consult your financial advisor before any investment.

HCC LEVELS FOR SWING TRADING 18/06/2024STOCKS FOR SWING TRADING (SHORT TERM) 18/06/2024
NO.3
#HCC
Buy Price - 45 (CMP 48)
SL - 40
TARGET - 60, 70 (30 - 50%)
@jagadheeshjp
Disclaimer : All information on this page is for educational purposes only,
we are not SEBI Registered, Please consult a SEBI registered financial advisor for your financial matters before investing And taking any decision. We are not responsible for any profit/loss you made.

HCC - A good bet to double TGTHCC positioned Nicely at Wolfe Wave
On Monthly Chart it has best R:R
Go for Blue Lines as TGTs

🏗️ Stock Alert: HCC Ltd 📈 🎯 Price Range to Buy: Rs. 44-45
🏗️ Stock Alert: HCC Ltd 📈
🎯 Price Range to Buy: Rs. 44-45
🎯 Targets:
💰 Short-term: Rs. 70
🚀 Mid-term: Rs. 100
🌟 Long-term: Rs. 120
📊 Investment Highlights:
📈 Profit-making company
🔄 Retesting strong support levels
🚨 Disclaimer:
Investing involves risks. Conduct thorough research and consult a financial advisor. Past performance doesn't guarantee future results. Invest responsibly. 💼💡
#HCC #Stocks #InvestmentOpportunity

HCC 1M swingHCC has show a fresh break out of cup an hendal pettarn in 1M cendal so this stock has best buying indicet for swing trade

Hindustan Construction should target 46.7Daily chart, the stock formed a rising wedge pattern, crossed the Resistance line (R).
After confirming another Close above 36, the target will be 46.7
Be careful: Stop loss if the stock closes below the Resistance line (R)
