HCL TECH1. Form Inside Bar in Monthly Candle
2. Weekly Candle formed Davas Box
RSI above 60 D / W / M
Expected move once cross recent high will give good upside move
Support 1727
HCLTECH trade ideas

hcltechafter a positive q2 results hcltech is touched new high and most securities and broking on positive on hcltech. and also we can see a inverse H&S shoulder so 1920 is my target only for educational purpose.

HCL tech chart analysisHCL tech chart analysis on daily time fame. This seems to be a range breakout. Please share your feedback and help me grow.
Please follow for more such charts.

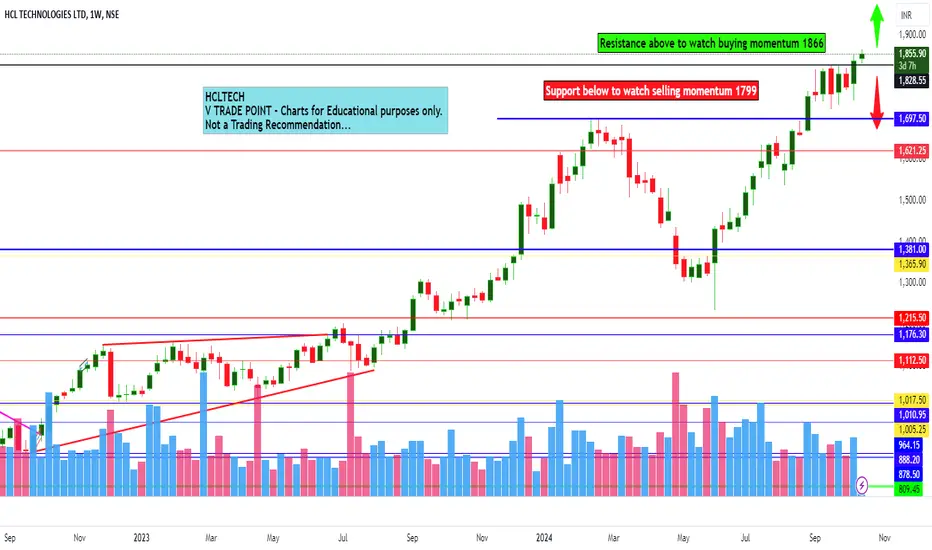
HCL Technologies Ltd view for Intraday 15th October #HCLTECH HCL Technologies Ltd view for Intraday 15th October #HCLTECH
Resistance 1850. Watching above 1866 for upside movement...
Support area 1800. Below ignoring upside momentum for intraday
Support 1800..Watching below 1799 for downside movement...
Resistance area 1850....
Above ignoring downside move for intraday
Charts for Educational purposes only.
Please follow strict stop loss and risk reward if you follow the level.
Thanks,
V Trade Point
Review and trading plan for 15th October 2024Nifty future and banknifty future analysis and intraday plan in kannada.
Positional trading ideas included.
This video is for information/education purpose only. you are 100% responsible for any actions you take by reading/viewing this post.
please consult your financial advisor before taking any action.
----Vinaykumar hiremath, CMT

LONG TRADEHCLTECH has reached an all-time high with a head and shoulder breakout in the daily time frame. Therefore, we can consider a long trade strategy, and in any dip, contemplate buying.

HCLTECH flaggingHCLTECH is flagging on the Daily/Weekly timeframe
Tried breaking out of the range today but got stuffed back below the upper trendline.
No position for me as of now as I am waiting for a break above the upper trendline to go long or break below the lower trendline to short.
IT ER season starts today with TCS being the first company among the IT pack to report earnings after market close today.
Alerts in place to trade accordingly

HCLTECH BullishSee in Chart,
Showing Cup and Handle Pattern in Weekly Chart..
Buy Range 1810-1740
Upside touch around 2100-2300-2500 in Short term
Our post only for Educational Purpose.
Contact to your Financial Adviser

Cup and Handle as well All.time high breakout in HCLTECHCup and Handle and ATH BREAKOUT is seen in Technical Chart Weekly time frame

HCLTech chart analysisHCLTech chart analysis on daily time frame. This stock has just broken its resistance and we can wait for it to sustain its resistance level.
please share your valuable feedback and follow for more such charts.

Darvas Box Strategy - Breakout StockDisclaimer: I am Not SEBI Registered adviser, please take advise from your financial adviser before investing in any stocks. Idea here shared is for education purpose only.
Stock has given break out. Buy above the High and do not forget to keep stop loss best suitable for swing trading. Keep this stock in watch list.
Target and Stop loss Shown on Chart. As stop loss is Big we keep Initial Target Ratio 1:1 & Target2 1:2.
Be Discipline, because discipline is the key to Success in Stock Market.
Trade what you See Not what you Think .

HCL TECH at yearly highs and rising!!HCL Technologies is demonstrating robust bullish momentum, positioning itself near its yearly highs. The stock has shown consistent strength, and technical indicators suggest a potential breakout could be imminent. With the current uptrend, investors should keep a close eye on the stock as it approaches key resistance levels. A confirmed breakout above these levels would not only mark a new yearly high but could also signal the start of a significant upward move, offering an attractive entry point for long-side traders.
The stock's performance is backed by strong fundamentals and positive market sentiment. Recent earnings reports have shown healthy growth, and the company continues to expand its global footprint, securing high-value contracts and strategic partnerships. This has built investor confidence, contributing to the stock's steady rise.
Volume analysis further supports the bullish outlook, with increasing trade volumes on up days, indicating strong buying interest. Traders should watch for a breakout with sustained volume, as this would add credibility to the move and reduce the risk of a false breakout.
Overall, HCL Technologies is a compelling candidate for a long trade. As it approaches its yearly highs, the stock presents a promising opportunity for those looking to capitalize on a potential breakout in a strong, trending market environment.

HCLTECH Looking Good...Buy HCLTECH at 1350 and all dips
Target1 - 1510
Target2 - 1690
Target3 - 1960 (if closing above 1690)
Disclaimer :-
I am not SEBI registered. The information provided here is for education purposes only.
I will not be responsible for any of your profit/loss with this channel suggestions.
Consult your financial advisor before taking any decisions

21.3% Upside Move IT StockHCL Tech is a leading global IT services company, which is ranked amongst the top five Indian IT services companies in terms of revenues. Since its inception into the global landscape after its IPO in 1999, HCL Tech has focused on transformational outsourcing, and offers an integrated portfolio of services including software-led IT solutions, remote infrastructure management, engineering and R&D services and BPO. The company leverages its extensive global offshore infrastructure and network of offices in 46 countries to provide multi-service delivery in key industry verticals.

HCLTECH Cup n Handle BreakoutHcltech very bullish
CUP N HANDLE breakout
CMP-1668
SL-1650
TARGET-1683/1701/1737
TIME-1-15 DAYS


HCL technologies for July 2024 current week There's support zone and trendline coming from bottom if price cross the zone then ride it .

HCLTECH-LONGTraders can consider long positions on a confirmation from order flow with appropriate risk management strategies.

Let's call you, mimic.This chart, or Stock rather, isn't something I've been watching, nor have heard about. However, given recent happenings, this one stock caught my attention.
I looked on the higher timeframes about the overall picture. Then later moved down to the 1hr timeframe you see now. If you notice, it's cleaned up more than some others I've posted, but everything has a meaning.
Looking back , we see a struggle to break below that dotted trendline, and support was there. Later we see some resistance to the right, near the two rectangular boxes, and what seems to be a reverse of what we initially saw.
Based on my quick markup I would expect some decline. What do you think about this idea? Leave a comment about why you disagree or agree with certain aspects of this idea! Have a great day/night.

HCL: To break or not to break? ️🩹Here are some pointers for HCL:
- HCL recently broke its range and the final resistance trendline.
- The breakout was quite close to a resistance zone. A bearish engulfing prompted selling, but retest and continuation potential remains.
- A retest candle with a long lower wick signifies bullish sentiment. Notice the price sustained over the trendline.
- Your support means a lot to us. Do consider boosting this Idea.
- A Sustained close above the resistance zone can pave the way for HCL's upward movement.
- Also, the Indian IT sector is approaching its critical resistance for the third time. (link in the comment section)
Caution: When the bull runs, everything seems Green. Being cautious always pays well. Remember, you will be buying the top.
Don't let the analysis end here! Boost, comment, and follow for more such insightful posts.
⚠️Disclaimer: We are not registered advisors. The views expressed here are merely personal opinions. Irrespective of the language used, Nothing mentioned here should be considered as advice or recommendation. Please consult with your financial advisors before making any investment decisions. Like everybody else, we too can be wrong at times ✌🏻

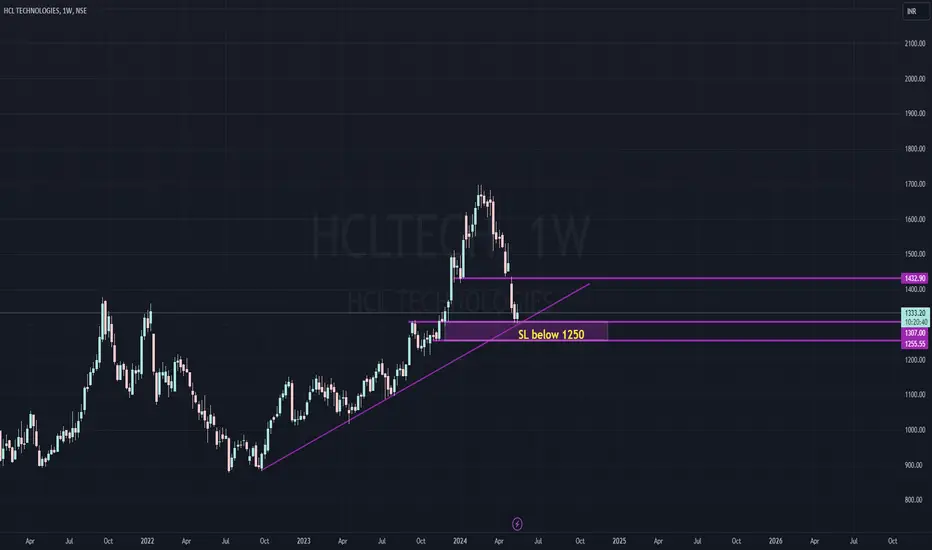
HCLTECH - ON WEEKLY TRENDLINEPossibility of a double bottom at 1300 seems likely... Looks good to accumulate in small quantities with a stop below 1250
Likely to bounce till 1460. Upon further consolidation, can head higher to 1600+ lvls
Review and plan for 16th July 2024 Nifty future and banknifty future analysis and intraday plan in kannada.
This video is for information/education purpose only. you are 100% responsible for any actions you take by reading/viewing this post.
please consult your financial advisor before taking any action.
----Vinaykumar hiremath, CMT

HCL Tech for a upmoveHCL Tech breaks the resistance with a strong candle. Expecting to move to ATH (8%)
This is only for Education purpose and not a Buy Sell Recommendations
