HCL TECHNOLOGIES Buy IdeaAs per my analysis, NSE:HCLTECH has given a breakout of downward trendline. Now there could be a buy opportunity if price retest level of 1160 with stop loss of 1125 (-35 points risk). My expected upside target would be 1180 (+20) and 1202 (+42).
Note: This is my personal analysis, only to learn stock market behavior. Thanks.
HCLTECH trade ideas

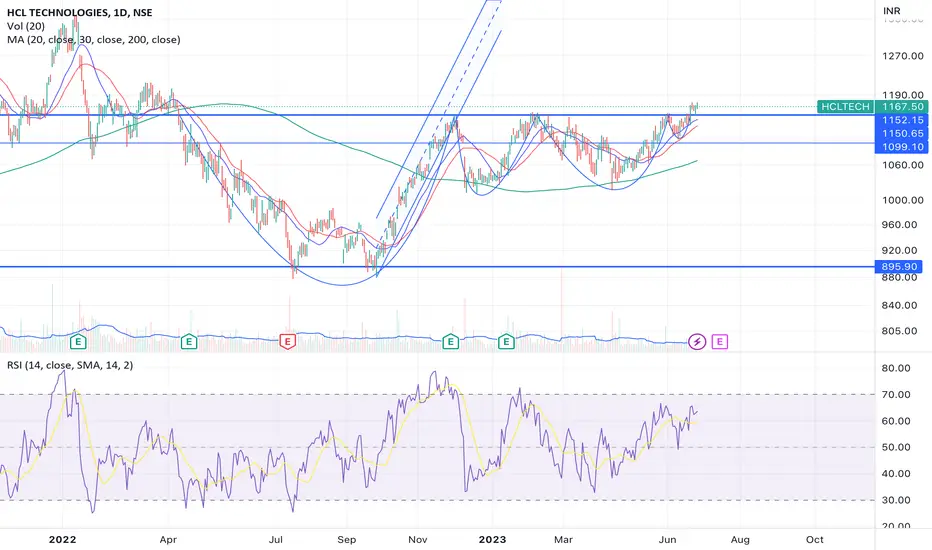
HCLTECH - Bullish Consolidation Breakout with VolumesNSE: HCLTECH is closing with a bullish consolidation breakout candle supported with volumes.
Today's volumes and candlestick formation indicates strong demand and stock should move to previous swing highs in the coming days.
The stock has been moving along the horizontal support for the past few days which is indicating demand.
One can look for a 8% to 13% gain on deployed capital in this swing trade.
The view is to be discarded in the event of the stock breaking previous swing low.
#NSEindia #Trading #StockMarketindia #Tradingview #SwingTrade

HCLTECH near BreakoutHCLTECH on day candle is nearing breakout showing bullishness on ascending triangle. Once the triangle breakout, for target 1210 and then 1350. Positional hold.

Hcltech buy postional tradeHclTech share elliot wave analysis
this stock flat correction complete
and 62% correction complete down

Swing trade After Trendling breakout after retest than entering!
Target price 1048 These are swing idea's which you can add your watchlist and analysis for yourself.
Keep on radar.
Potential upside stock!

#HCLTECH - Short Opportunity#HCLTECH - Short Opportunity
Stock gave a false break out & gave closing below resistance
Good opportunity to short below previous weekly candle low

HCLTECH--Retested Trendline ??price broken the trendline strongly and now it tested the trendline....
if price fall or continue move upwards....
will looking for short entry....Will update once it is reversed.

HCLTECH - WEEKLY CANDLE LOWER PRICE REJECTION.HCLTECH
Everything is clearly mentioned on the chart it self.
Breakout of the supply zone plus lower price rejection at 200 ma while retesting the level.
As I am writing this the market is highly bullish and global market sentiment is also highly bullish.
Thank you.

Hcl tech disastrous chart On monthly chart of hcl tech on verge of major breakdown of trendline for the target of 700 upto positional

HCLTECH--Near it's Demand zone??Observations::
This stock is in uptrend...now its near demand..look for buy.
A strong bullish momentum is observed from this zone...1180
it has taken support from this zone multiple times...
now again it is at the same zone....
look for buy side...
weak momentum to the bottom side is also observed.
if we see a strong fall is observed from this zone 1196...
it will test soon before falling again from this zone...


HCLTECH Weekly Timeframe Breakout HCLTECH Weekly Timeframe Breakout
hcltech From few days follow pettern and after long time breakout weekly timeframe so upside big target expected. current price 1165.15 and next target 1272.
all level is perfect work so carefuly trade this IT stock


HCLTECH bullish with conditionsIf daily candle closed above 1184 then make entry
Strong sl 1168Rs
If conditions not meet then don't trade.
Next final entry at 1050Rs
Target 1196 Rs

HCL Tech: Teching Off?We might be witnessing volatility contraction here, this counter can give gain from here, targets on the chart as horizontal lines.
HCL TECH Range breakout and retested .keep watching
We can see good upward rally.its only for back testing

Range Breakout in HCL TechIn HCL tech range 1015 - 1150 breakout occur.
may be it comes to 1160 Support level and going to 1200 resistance level in short term.
entry 1160
profit 1200
stoploss 1133
R:R around ~ 1:1.48

HCLTECH BREAKOUTHCLTECH Has given a beautiful breakout, aggressive trader can jump here but who are safe trader wait for retest.

HCLTECH--Facing Resistance in this zone @1155 ??Observations::
---The stock price is again facing resistance from this zone @1155 multiple times.
if price breaks this range on top we have targets at 1163 and 1180, in this zone price has consolidation to fall is happen. keep track this levels.
--->> if price breaks this we have next resistance @1200 range.
if we in 1hr time frame, its still in bullish.
price taken the support from 1105 zone.
price has taken the support from this zone multiple times.
If price breaks this zone @1125 range, look for sell @1132 for target of bottom side bullish gap.
keep 1st target @1115 ,rest at cost to cost.

HCL TechBuy HCL Tech
Cmp 1144
Target 1180
2nd Target 1200
SL 1100
HCL Tech has been done partnership with microsoft,
Trend line break
Sector support with volume

HCLTECH viewsThis script has shown, positive reaction from the value area which is recent.
If this area is being respected, then we can see the near target as shown in the chart drawing. Worth watching it for study purpose.

HCLTECH--Short term Bearish look??Observations::
After a strong fall from resistance price slowly reached the resistance again and starts falling.
we have demand zone in the range 1105, price will test that demand zone,
initially look for buy @1105 level,for 1130 range only.
if another demand zone @1135 resist price fall is more,and will reach the bottom zones at 1070 levels.
Keep track this levels...

HCL TECHforming ascending triangle + double bottom on weekly TF. and IT sector looks good for investment at this point of time ..good pick for medium to lomg term
