HDFCAMC All the key levels are mentioned in chart
Disclaimer
I am not sebi registered analyst
My studies are Educational purpose only
Please consult with your Financial advisor before trading or investing
HDFCAMC trade ideas


Double BottomThere is formation of double bottom in HDFCAMC. looking positive for trade. This information is only for educational purpose.

Double BottomDouble bottom pattern has been formed in HDFCAMC. It is very stron W shape pattern. Entery for trade is an opportunity. Consult your advisor before taking this trade. This is only for educational purpose.


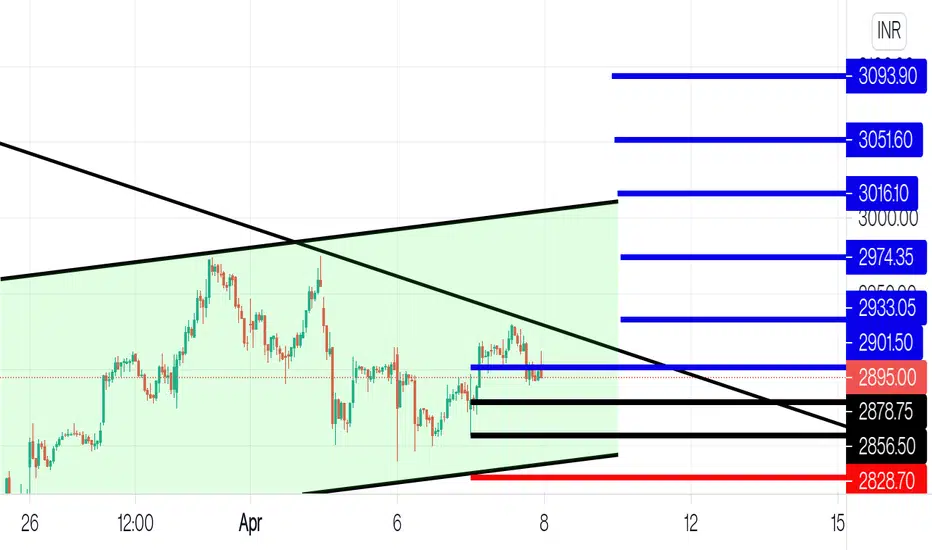
Short in HDFCAMCNSE:HDFCAMC
Looking for a short opportunity in HDFCAMC ... Sell below 2902 only
Time Frame: Daily
Targets: 2844/2678/2500/2400

HDFC AMCH&S Pattern formation, If markets opens weak on Monday can test long term support placed @2790

One more opportunityHello traders, once again, i am looking an opportunity in HDFCAMC here, logic behind the trade is, it is crossing the 20 EMA and MACD & RSI are also looking bullish on daily chart. There are possiblities to go higher at the level 3350 and support must be at the level 3025 ! Good luck!!!

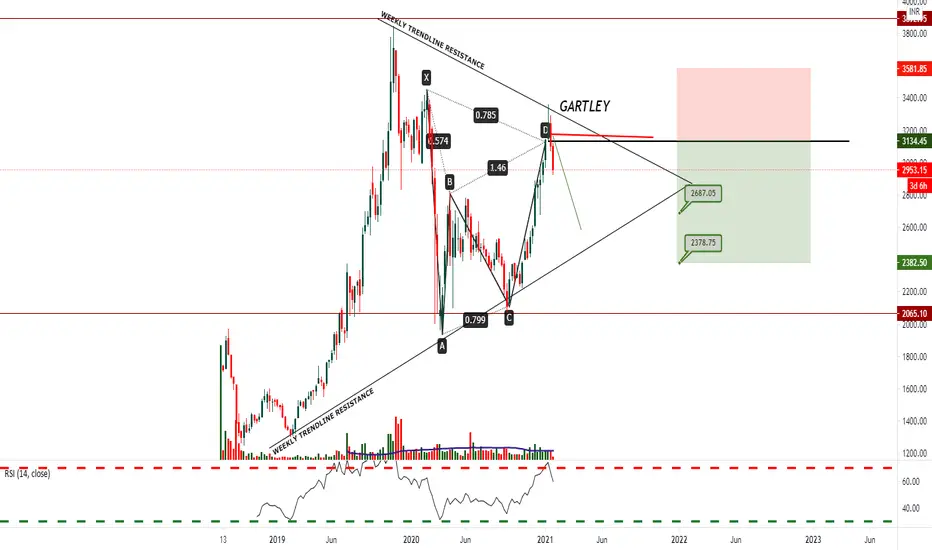
HDFCAMC Daily Confluence of WEEKLY Bearish GARTLEY & Daily Bearish Deep Crab STRONG POTENTIAL REVERSAL ZONES
Price need to follow GREEN TREND LINE and hit Target 1 & 2 , else if Price BREAKS RED TREND LINE is EXIT
POTENTIAL SELL

HDFCAMC WEEKLY Bearish GARTLEY
Price need to follow GREEN TREND LINE and hit Target 1 & 2 , else if Price BREAKS RED TREND LINE is EXIT
POTENTIAL SELL
BEAUTIFUL BREAK OUT!INVERTED HEAD AND SHOULDER BREAK OUT.BUY AT CMP. STOP LOSS EXIT IF CLOSES BELOW 2400.TARGET 2975.I AM INTO IT,ARE YOU? HAPPY TRADING FRIENDS.

HDFCAMC - Rounding Bottom after a smooth Rally - IntradayThis analysis is done purely on basis of price action and chart patterns.
The analysis is done on 15 min TF hence target can be achieved same day or in a couple of days
Logic, Entry range, SL and Target is shown in image itself.
This analysis is for study purpose. Traders must do their own study before entering into any trade. Traders should trade with their own risk capacity and money management.
Feel Free to comment for any query or suggestion regarding this stock or Price Action Analysis
To understand how rounding bottom gives a blast move on breakout -
Check below case of BALMLAWRIE and DHANUKA for examples of Rounding Bottom Pattern

#HDFCAMCTrading above its very strong resistance. if it closes above the red band this week, next target would be around 3000, then 3200, then 3400, then ATH.


