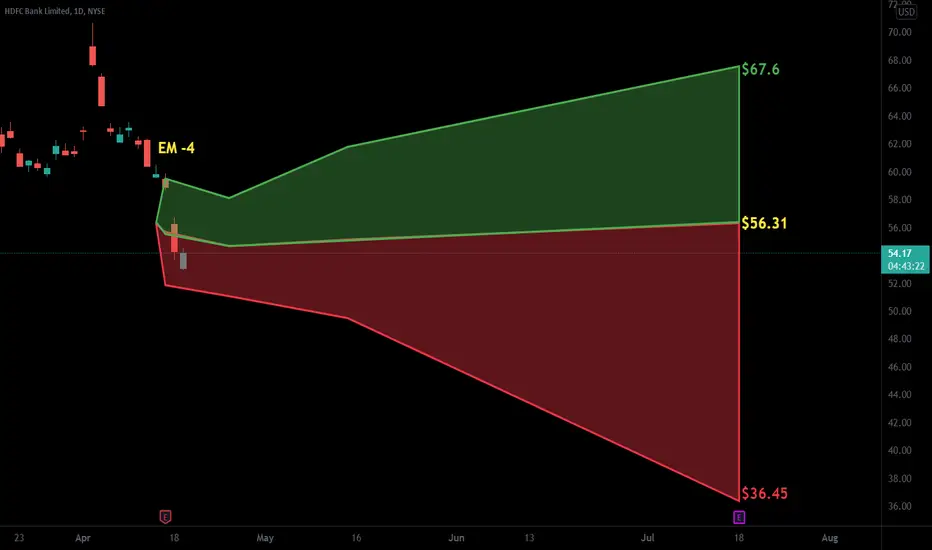
$HDB with a Neutral outlook following its earnings #Stocks The PEAD projected a Neutral outlook for $HDB after a Negative over reaction following its earnings release placing the stock in drift C with an expected accuracy of 66.67%.
HDFCBANK trade ideas


Support LevelLets see if it holds at this support level.....found support at this level earlier and looks like a good zone
Disc : Not holding and not a buy or sell recommendation.

HDFCBANK forcast on the weekly chart : the price did a wide gap downwards and made a decent red candle so far
on the daily chart : breaking a level and going down strong
on the 15 min chart : the price had went bellow the VWAP meaning the day will end red
personal opinion : the price will keep on going down until reaching the middle level with 80% of bouncing of it heading up
best move
daytrading : opening short positions in this week
long term traders : wait until the price reach the level and gives a clean indication of and uptrend


HDFC BANK Trend AnalysisBearish divergence shown by RSI on weekly timeframe with weekly close as a strong bearish pin bar candlestick shows there is strong bearish pressure.
Do not jump to buy because of the merger and everyone is bullish.
Let the price fall to buying zone for a big rally upside.
Buying Zone is around 1100-1175 level
Target 1 2350 (100% ROI) Medium Term
Target 2 3350 (190% ROI) Long Term
All price levels mentioned above are Fibonacci levels.
This heavyweight will drag bank nifty down for sure.
This is just my analysis purely based on technicals only.
Kindly do your due diligence before trading or investing.
Peace!!

HDFC bank taken support from major support. HDFC bank looking good for buying above 1527 and stop-loss below 1480. it will move drastically because of the earnings on 13th of April. and as far the technicals are concerned its near the major resistance and already retraced 50% of the fibonacci levels.

HDFC BANK Reversal Good support for HDFCBANK at 50% fib level on a daily timeframe and the volume supports the momentum and trend reversal is expected.
This is for educational purpose only.

HDFC Is giving good trades, support/resistance indicatorSee how the true supports and resistances of the future are shown in realtime bh the indicator.

HDFC Bank Long setupInverse Head and shoulder breakout can be seen on daily chart.
Can see 10% up move in short time.
Taret 1650+
CMP 1507.

HDFCHDFCBANK made an inverted head & shoulder pattern on daily charts with good volumes.
Could be bought with mentiones stoploss & targets.

HDFCBANK Verge of BreakoutHDFCBANK is showing breakout signs after forming IH&S pattern with good volumes. Post this breakout this can be good swing trade for short/medium term.
Levels are explained in charts
Disclaimer: This study is for educational purpose only & is not buying or selling recommendations. I am not SEBI registered. Please consult your financial advisor before taking any trade.


Intraday Trade#We make only profit.
#BANKNIFTY #TCS #RELIANCE #HDFCBANK
#Dont buy any trade Without Stoploss

HDFCBANK Short IdeaNSE:HDFCBANK
Short idea
Price Reversal after test 1515 to 1500 Range
--------------------------------------------------------------------------
Closed below 200 EMA on Daily time frame
Strong level between 1515 to 1500 also a psychological level
Unfilled Gap below previous trading range
Decrease in Volume

#HDFCBANK LEVEL#We make Only Profit
#All Important Level in HDFCBANK
#BANKNIFTY #NIFTY #TCS #RELIANCE #HDFCBANK

HDFC may again 1300As per my view we may see the level 1300 again.... those who not buy the level, buy this time...

HDFC Bank Short Sell for a target of 1375 LevelSeems that HDFC Bank is in corrective phase, batter to go in short with a sl of recent high made or around 61.8% Retrechment of 5th wave highest point

HDFC BANK there is seen a positive divergence in hdfc bank if hold today low than we can see 1450++ level in upcoming days.
Note : This information is based on purely study purpose before taking any descion about this information please consult your financial advisor.
Thanks & Regards
Vishal
Technical Analyst

HDFC Bank Under pressureHDFC Bank Under pressure
if Break out below 1370 expect more fall
H&S pattern break down


HDFC BANKHDFC BANK - Mean reversion set up
There are good chances of a reversal from this zone.
P.S - Only high risk investors/traders should enter here.
