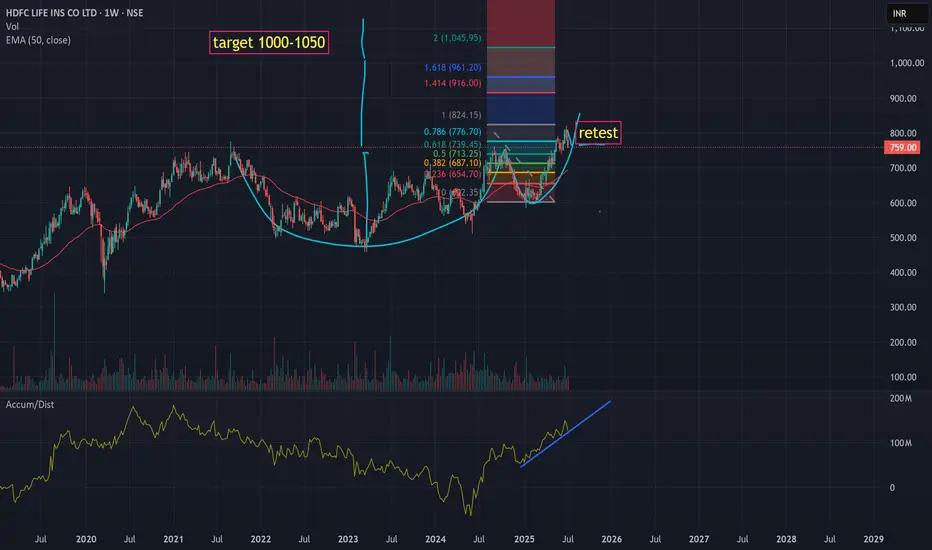
should move to 1000 Range after current retest of breakout Should try to breakout from the support retest as there is no negative news and result is due this week. Should run to 820-850 this week before results if not manipulated.
HDFCLIFE trade ideas
Long HDFC life:
-Price takes support at 20 Daily EMA
-Bullish Engulfing Candle
- Enter long when the price is favorable in lower time frame
- SL: Close below 20 Daily EMA

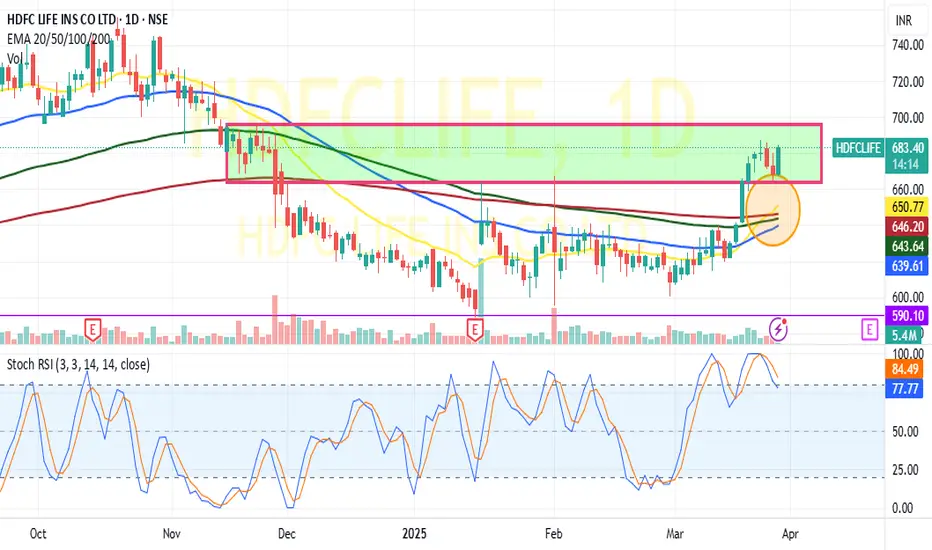
HDFC life Long _ Support @ 20 Daily EMAHDFC life:
-Price takes support at 20 Daily EMA
-Bullish Engulfing Candle
- Enter long when the price is favorable in lower time frame
- SL: Close below 20 Daily EMA

Buy Hdfclife insurance perfect Target 876Everything mention about in my chart
Technically very strong confirmation
Technical 3 indicator
1st indicator channel flying price 769
2nd indicator filag price 788
3rd Elliott wave target 876
small stoploss 801 day closing
conclusion ; I am not sebi reg Not recommendation to buy this is my own idea only,,
Happy trade
Regards,
Vishnu barath (Tamil Nadu)

HDFC Life Insurance Buy27-Jun-2025 (Friday)
HDFC Life Insurance reversed taking support from channel line as well as it previous ATH. Seems to make false breakdown and reversed upside to new ATH. Buy @CMP (807) with SL of 770 and target of 840-860

Hdfc life gives breakout of 4 year consolidation zoneHdfc life gave weekly breakout of 4 year consolidation zone.

Cup and handle pattern Retesting the cup and handle pattern.
Good to go long in it.
Educational purposes only.

Clear bullish indication Newly breakout and was telling us to going up.
Just for educational purposes


HDFC Life Insurance – Bullish Breakout on Monthly ChartHDFCLIFE is forming a strong ascending triangle on the monthly chart, signaling long-term bullish potential. A breakout above ₹750 with volume can trigger a fresh rally toward ₹880–₹920 in the coming months. RSI is trending up with strong momentum, which confirms buying interest. In the short term, ₹715 acts as support. Long-term investors can accumulate on dips.
Short-Term View: Buy on dips above ₹715 | Target ₹780
Long-Term View: Breakout above ₹750 | Target ₹900+
For educational purposes only

HDFC Life Insurance Company Ltd view for Intraday 25th April #HDHDFC Life Insurance Company Ltd view for Intraday 25th April #HDFCLIFE
Resistance 715 Watching above 716 for upside movement...
Support area 700 Below 705 ignoring upside momentum for intraday
Watching below 698 for downside movement...
Above 705 ignoring downside move for intraday
Charts for Educational purposes only.
Please follow strict stop loss and risk reward if you follow the level.
Thanks,
V Trade Point

HDFC LIFE:Goldenn Cross -20DEMA vis-a-vis50,100,200DEMAHDFC LIFE: Trading above all its 20DEMA,50DEMA,100DEMA &200DEMA,20DEMA Golden cross above other DEMAs indicates a possible move towards 700-720 band(For educational purpose only)
BUYING SWING TRADE HDFC LIFE Last week HDFC LIFE presented Q3 result , which looks good compare to last Quarter, HDFC life had corrected nearly 45% from its recent high and consolidating near buying range. OUR research initiated BUY rating from current levels.
BUY RANGE : 620-625
STOPLOSS : 578
TARGET : 678-700
REWARD:RISK : 2:1

HDFC LIFE HDFC LIFE is tricky stock, showing very zigzag move , but now its in downtrend , and if it not sustains above marked resistance then it will sharply, so watch and observe it as per chart markings

HDFCLIFE is in good accumulation phase..HDFCLIFE is in good accumulation phase one can start buying for higher targets above 1000.
Disclaimer: only study purpose, do your own research before buying.

HDFCLIFE Trading Above Fresh Demand ZoneHDFCLIFE is currently trading at ₹623, above its fresh demand zone between ₹608 and ₹600, established on 8th July 2024. This zone has not yet been tested, indicating potential buying interest if the price revisits this range. Investors may watch for a pullback to this level for possible entry opportunities.
Disclaimer: This analysis is for informational purposes only and should not be considered as financial advice. Please conduct your own research or consult a financial advisor before making any investment or trading decisions.

Upside price movement Can start in Hdfc Life insurance According to Elliott wave analysis, Price is all set to start its wave 3 till 1000rs first target.
Fundamentals are supporting its technicals so its perfect time to buy in price range 620 to 650
Date 20 dec 2024
1=Balance sheet- good, 3 on 3
2= a= sales, profit- increasing, highest this year
b= employee & staff expense- increasing
c= interest- 0
d= profit before and after tax- highest
3= Investor - fii/dii are there, public has only 6%
4=Credit Rating = AAA
5= General details
a= Market cap=1,33,600cr
b= pe=79 ,median pe= 91, industry pe=53.4
c= ROCE=6.6 , ROE=11.4 , Debt = no
Amazing Fundamentals.

HDFCLIFE--@Trendline RetestThis stock previously broken the trendline strongly
Now price is near to its trendline retest area.
While breaking the trendline price leaves a demand zone .
We have to look for potential buying opportunities in this stock for long side continuation.
Demand Zone lies at 605 Levels.
Look for buying in this stock.

SWING IDEA - HDFC LIFE INSURANCE HDFC Life Insurance , one of India's leading life insurance companies, is showing strong technical signals for a swing trade.
Reasons are listed below :
750 Zone Breakout : This level has been tested several times and the stock is now poised to break out, indicating potential upward momentum.
Breaking Consolidation Zone of 3.5+ Years : The stock is emerging from a prolonged consolidation phase, which could signal the start of a new bullish trend.
Highest 52-Week Close : It recently achieved its highest close in the past 52 weeks, reflecting strong market sentiment.
Trading Near All-Time High : The price is approaching its all-time high, showing that the bullish momentum is intact.
Trading Above Weekly 50 and 200 EMA : This reinforces the positive outlook, with the stock maintaining its position above key moving averages.
Target - 870 // 990
Stoploss - weekly close below 660
DISCLAIMER -
Decisions to buy, sell, hold or trade in securities, commodities and other investments involve risk and are best made based on the advice of qualified financial professionals. Any trading in securities or other investments involves a risk of substantial losses. The practice of "Day Trading" involves particularly high risks and can cause you to lose substantial sums of money. Before undertaking any trading program, you should consult a qualified financial professional. Please consider carefully whether such trading is suitable for you in light of your financial condition and ability to bear financial risks. Under no circumstances shall we be liable for any loss or damage you or anyone else incurs as a result of any trading or investment activity that you or anyone else engages in based on any information or material you receive through TradingView or our services.
@visionary.growth.insights

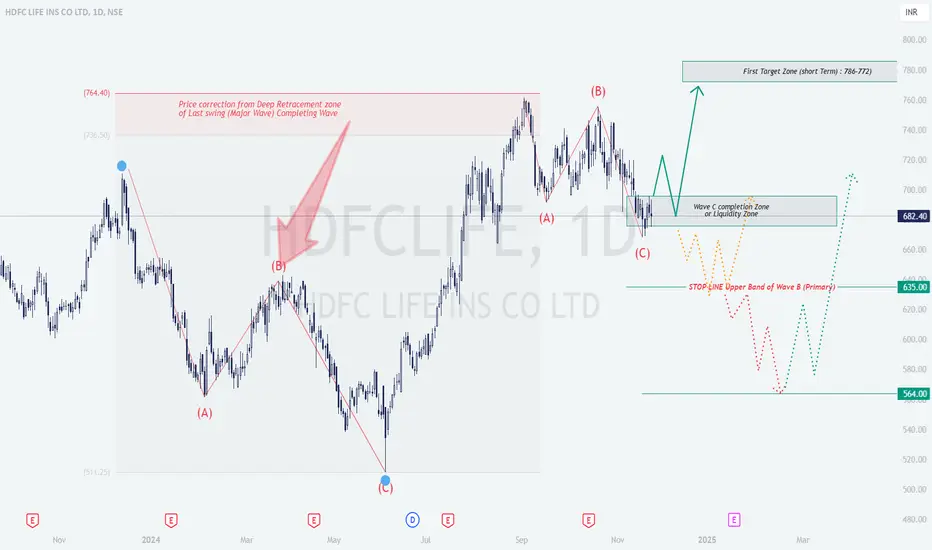
HDFCLIFE: Elliott Wave Signals Reversal or Breakdown? Understanding the Current Setup
The chart reflects a corrective Elliott Wave structure (ABC pattern):
Wave A: Initial decline from the peak of ₹764.40.
Wave B: Pullback to a resistance zone after Wave A.
Wave C: Continuation of the downtrend, nearing a potential completion zone or liquidity zone around ₹670-680.
The stock is currently consolidating near this Wave C completion zone, signaling a possible reversal to the upside.
Trade Setup Explanation
Bullish Setup:
Logic: If Wave C concludes within the Liquidity Zone (~₹670-682), an upward reversal is anticipated toward the first target zone at ₹772-786.
Entry Point: Enter after a clear breakout or reversal signal (e.g., bullish candlestick, trendline breakout, or volume spike).
Targets:
- Target 1: ₹772-786.
- Target 2: Further upside based on price action.
Stop Loss: Below the Wave C lower boundary (~₹635).
Bearish Setup (Alternate Scenario):
Logic: A breakdown below ₹635 suggests further downside.
Entry Point: Short on confirmation of a breach below ₹635.
Target: Next support zone at ₹564.
Stop Loss: Above the Liquidity Zone (~₹680).
Technical Analysis Insights
Fibonacci Levels: Wave B retraced deeply (likely 61.8%-78.6% of Wave A). Wave C aligns with extensions (1x or 1.618x of Wave A).
Liquidity Zone: The ₹670-682 zone is a demand area where institutional buying might occur. Look for bullish candlestick patterns for confirmation.
Target Zone: ₹772-786 is a key resistance area, ideal for profit-taking in a bullish scenario.
Stop-Loss Placement: Logical stops are set below the invalidation levels (~₹635 for bulls, ~₹680 for bears).
Prediction and Plan
Primary Scenario (Bullish): Wave C completes in the Liquidity Zone, leading to a reversal targeting ₹772-786.
Alternate Scenario (Bearish): Breakdown below ₹635 invalidates the bullish outlook, with potential downside to ₹564.
Educational Takeaway
Elliott Wave Application: Highlights an ABC correction and potential reversal.
Risk Management: Use stop losses at key invalidation levels to minimize risks.
Confirmation Tools: Enhance reliability using indicators like RSI divergence, MACD crossovers, or volume spikes.
Patience: Wait for price action confirmation before entering trades.
This structured plan ensures adaptability to both bullish and bearish scenarios while maintaining disciplined risk management.
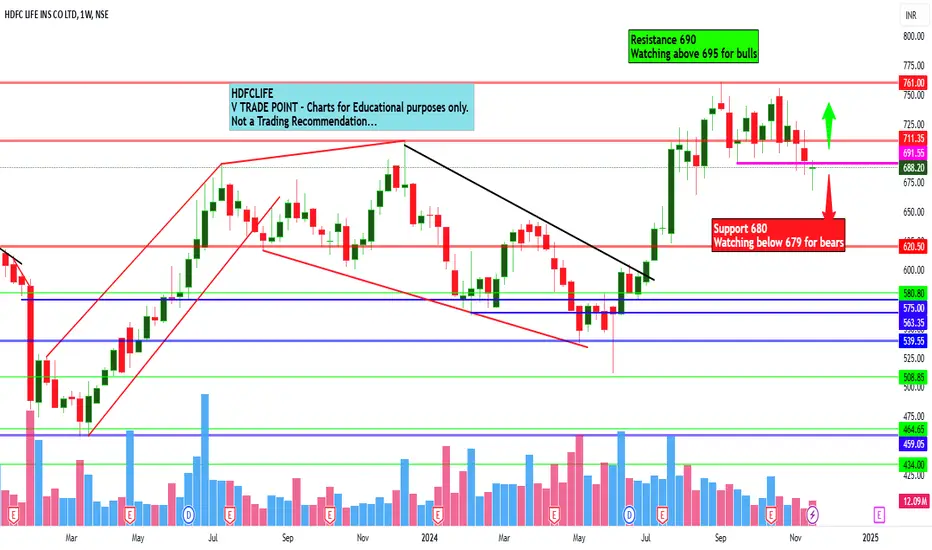
HDFC Life Insurance Company view for Intraday 25th Nov #HDFCLIFEHDFC Life Insurance Company view for Intraday 25th Nov #HDFCLIFE
Resistance 690. Watching above 695 for upside movement...
Support area 680 Below 688 ignoring upside momentum for intraday
Support 680 Watching below 679 for downside movement...
Resistance area 690
Above 688 ignoring downside move for intraday
Charts for Educational purposes only.
Please follow strict stop loss and risk reward if you follow the level.
Thanks,
V Trade Point
Buy HDFCLIFE 593 TGT 720/940/1204 avg @ 505 Sl Below 418The Stock had been in consolidation and starting to show divergence on RSI and price. Also the increase in volume at lower levels suggesting that stock is in accumulation phase and is ready for the breakout for the above mentioned targets.

HDFCLIFE Trading Within Fresh Demand Zone of ₹689.4-₹678.5HDFCLIFE is currently trading at ₹690.3, which is within its tested demand zone ranging from ₹689.4 to ₹678.5. This zone may attract buying interest, providing potential support for the stock. Investors can watch for price stability or upward movement from this range to gauge entry opportunities.
