HDFC LIFE - BUYNSE:HDFCLIFE Outperforming whole insurance sector, but as of now this stock is near life time high and consolidate from last 3 months. Will continue bullish next 6 to 12 months.
HDFCLIFE trade ideas

Bullish on HDFCLIFE - A resilent stock in the midst of the crashHDFC Life is showing good bullish traction.
Stock has been consolidating since Sep-'24.
It has give a breakout this week, did a re-test of the zone and has held it which shows good strength.
RSI is super Bullish on all High time frames which indicates momentum.
I have taken a Long position and maintained SL around 715 level.
Target would be 860.
Not a recommendation. This is my view.

HDFC Life Insurance view for Intraday 17th October #HDFCLIFE HDFC Life Insurance view for Intraday 17th October #HDFCLIFE
Resistance 730. Watching above 731 for upside movement...
Support area 720. Below ignoring upside momentum for intraday
Support 720..Watching below 719 for downside movement...
Resistance area 730....
Above ignoring downside move for intraday
Charts for Educational purposes only.
Please follow strict stop loss and risk reward if you follow the level.
Thanks,
V Trade Point

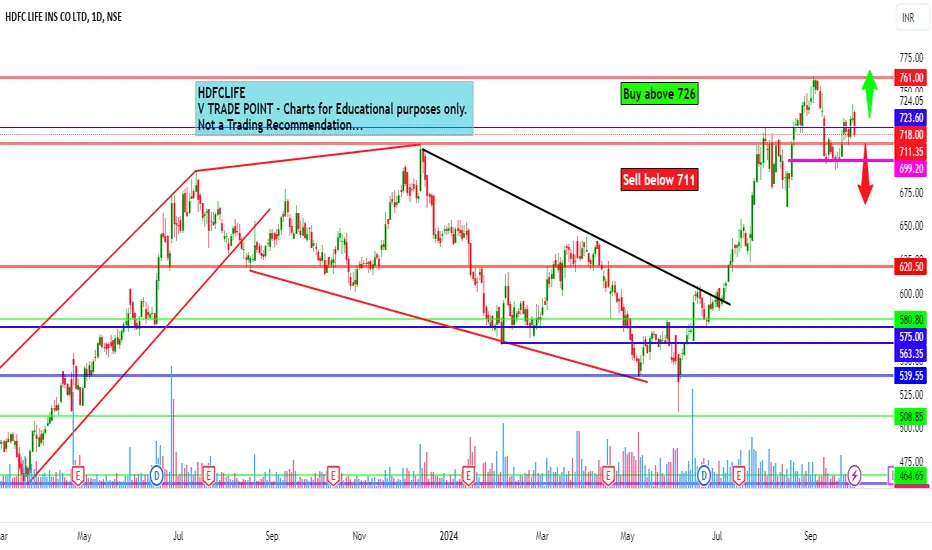
HDFC Life Insurance Company Ltd view for Intraday 1st October #HHDFC Life Insurance Company Ltd view for Intraday 1st October #HDFCLIFE
Buying may witness above 726
Support area 720. Below ignoring buying momentum for intraday
Selling may witness below 711
Resistance area 720
Above ignoring selling momentum for intraday
Charts for Educational purposes only.
Please follow strict stop loss and risk reward if you follow the level.
Thanks,
V Trade Point
HDFC Life Insurance Company LtdHDFC Life Insurance Company Ltd is up for a third straight session today. The stock is quoting at Rs 723.5, up 1.74% on the day as on 12:49 IST on the NSE. The benchmark NIFTY is up around 0.3% on the day, quoting at 25867.5. The Sensex is at 84684.03, up 0.17%. HDFC Life Insurance Company Ltd has slipped around 0.3% in last one month.

HDFC Life Insurance Company Ltd view for Intraday 20th SeptemberHDFC Life Insurance Company Ltd view for Intraday 20th September #HDFCLIFE
Buying may witness above 708
Support area 696-700. Below ignoring buying momentum for intraday
Selling may witness below 696
Resistance area 705-708
Above ignoring selling momentum for intraday
Charts for Educational purposes only.
Please follow strict stop loss and risk reward if you follow the level.
Thanks,
V Trade Point

HDFC Life Insurance Company Ltd view for Intraday 17th SeptemberHDFC Life Insurance Company Ltd view for Intraday 17th September #HDFCLIFE
Buying may witness above 708
Support area 695. Below ignoring buying momentum for intraday
Selling may witness below 695
Resistance area 705-708
Above ignoring selling momentum for intraday
Charts for Educational purposes only.
Please follow strict stop loss and risk reward if you follow the level.
Thanks,
V Trade Point

HDFC Life Insurance view for Intraday 9th September #HDFCLIFE HDFC Life Insurance view for Intraday 9th September #HDFCLIFE
Buying may witness above 745
Support area 732. Below ignoring buying momentum for intraday
Selling may witness below 732
Resistance area 745
Above ignoring selling momentum for intraday
Charts for Educational purposes only.
Please follow strict stop loss and risk reward if you follow the level.
Thanks,
V Trade Point

HDFC LIFE Insurance Company Ltd view for Intraday 5th September HDFC LIFE Insurance Company Ltd view for Intraday 5th September #HDFCLIFE
Buying may witness above 762
Support area 749-750. Below ignoring buying momentum for intraday
Selling may witness below 749
Resistance area 760-762
Above ignoring selling momentum for intraday
Charts for Educational purposes only.
Please follow strict stop loss and risk reward if you follow the level.
Thanks,
V Trade Point

Keep Eye on this stock it's about to break outIt can be break out of stock but wait until no great volume visible

Hdfc life elliot wave analysis Hdfc life share one hour time period analysis . normal flat correction complete . and wave c 2 or 4 trendline breakout and second breakout 0-b trendline breakout

Hdfc life elliot wave analysis Hdfc life share one hour time period analysis . normal flat correction complete . and wave c 2 or 4 trendline breakout and second breakout 0-b trendline breakout

HDFC LIFE INSURANCE S/RSupport and Resistance Levels: In technical analysis, support and resistance levels are significant price levels where buying or selling interest tends to be strong. They are identified based on previous price levels where the price has shown a tendency to reverse or find support.
Support levels are represented by the green line and green shade, indicating areas where buying interest may emerge to prevent further price decline.
Resistance levels are represented by the red line and red shade, indicating areas where selling pressure may arise to prevent further price increases. Traders often consider these levels as potential buying or selling opportunities.
Breakouts: Breakouts occur when the price convincingly moves above a resistance level (red shade) or below a support level (green shade). A bullish breakout above resistance suggests the potential for further price increases, while a bearish breakout below support suggests the potential for further price declines. Traders pay attention to these breakout signals as they may indicate the start of a new trend or significant price movement.
20 EMA: The yellow line denotes 20 EMA, to interpret the 20 EMA, you need to compare it with the prevailing stock price. If the stock price is below the 20 EMA, it signals a possible downtrend. But if the stock price is above the 20 EMA, it signals a possible uptrend.
Disclosure: I am not SEBI registered. The information provided here is for learning purposes only and should not be interpreted as financial advice. It is important to consult with a qualified financial advisor before making any investment decisions. Tweets neither advice nor endorsement.

HDFCLIFE-LONGBullish trend in formation on HDFCLIFE Price action suggests further upside potential. Key support and resistance levels to watch. Consider long position with appropriate risk management.


HDFCLIFE shows reversal BUYAfter 6 months of downtrend, stock shows reversal to break the down trend channel.
606 price looks promising to buy this stock.

Hdfc life probable head and shoulderHdfc life probable head and shoulder currently showing signs of reversal so it can be assumed that it will come to marked support and then go up by doing so it will form reverse head and shoulder

HDFCLIFE- AnalysisBullish Levels -Day closing above 642 Safe entry above 688 then 789 then 890 then 991 above this more bullish for Long term investors we can expect around 1396 then around 1800
Bearish levels :- Day closing below 633 (SL for Swing trade Investor) then 587 then 485 (SL for Long term Investor) below this more bearish.
**Consider some Points buffer in above levels
**Disclaimer -
I am not a SEBI registered analyst or advisor. I does not represent or endorse the accuracy or reliability of any information, conversation, or content. Stock trading is inherently risky and the users agree to assume complete and full responsibility for the outcomes of all trading decisions that they make, including but not limited to loss of capital. None of these communications should be construed as an offer to buy or sell securities, nor advice to do so. The users understands and acknowledges that there is a very high risk involved in trading securities. By using this information, the user agrees that use of this information is entirely at their own risk.
Thank you.

HDFC Life Insurance Intraday level for 9th July #HDFCLIFE HDFC Life Insurance Intraday level for 9th July #HDFCLIFE
Buying opportunity above 623
Support area 616-616. Below ignoring buying opportunity
Charts for Educational purposes only.
Please follow strict stop loss and risk reward if you follow the level.
Thanks,
V Trade Point

HDFC LIFE Insurance Bank Intraday level for 4th July #HDFCLIFE HDFC LIFE Insurance Bank Intraday level for 4th July #HDFCLIFE
Buying opportunity above 601
Stop Loss area 595
Selling opportunity below 590
Stop Loss area 595
Charts for Educational purposes only.
Please follow strict stop loss and risk reward if you follow the level.
Thanks,
V Trade Point

HDFC life insurance buying opportunity Wave pattern target is 698,almost 17%.
HDFC life buying opportunity


