HDFCLIFE trade ideas


Breakdown of major support in hdfc life Will go short below 654 stoploss 662
Targets 644/630 and below


HDFCLIFE BUyHDFCLIFE Buy for day trading if break the given resistence and then we will enter in trade

HDFC Life (Long)See HDFC Life we have shared earlier
buy at 700 -720
Tgt 759 - 775 - 800
SL 650 -675
Please Correlate by yourself also on charts. This is for Educational and Paper Trading Purpose Only. Must Consult your financial advisor before Investing.
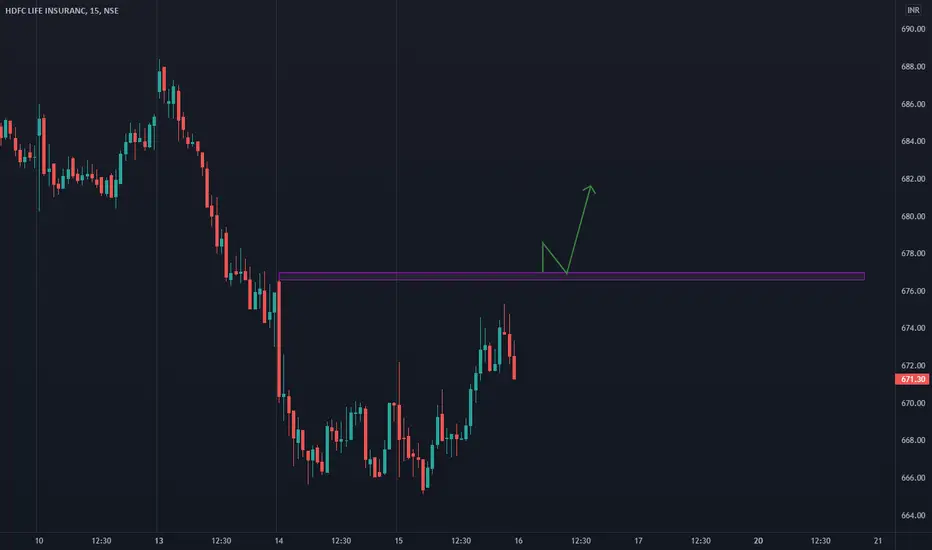
HDFCLIFE - Long view for Educational purpose onlyThe stock has moved above its major support area and is trading above the next support area of 674 levels.
We have a strong bullish candle on the daily time frame.
Kindly refer below mentioned trade details for study only.
BUY
ENTRY 700
STOP LOSS 691
TARGET 723
PROFIT 2556
LOSS 1000
QUANTITY 111
On the lower side
SELL
ENTRY 670
STOP LOSS 680
TARGET 639
PROFIT 3100
LOSS 1000
QUANTITY 100

Head & Shoulders pattern in HDFC_LIFE.This stock is heavily traded by computers as it forms quite unusual consolidations and unidentifiable patterns, although while lurking into its chart for awhile, I saw a pretty clear head & shoulders(which indicated a bull run inbound). This thread isn't really a forecast but just for a small record that how we can earn from algorithmic traded stocks. Just look for typical supply and demand zones, and ride the trend when you can, though your profit margins wouldn't be much, however a big lot size would do the trick.
-Happy Trading !!!

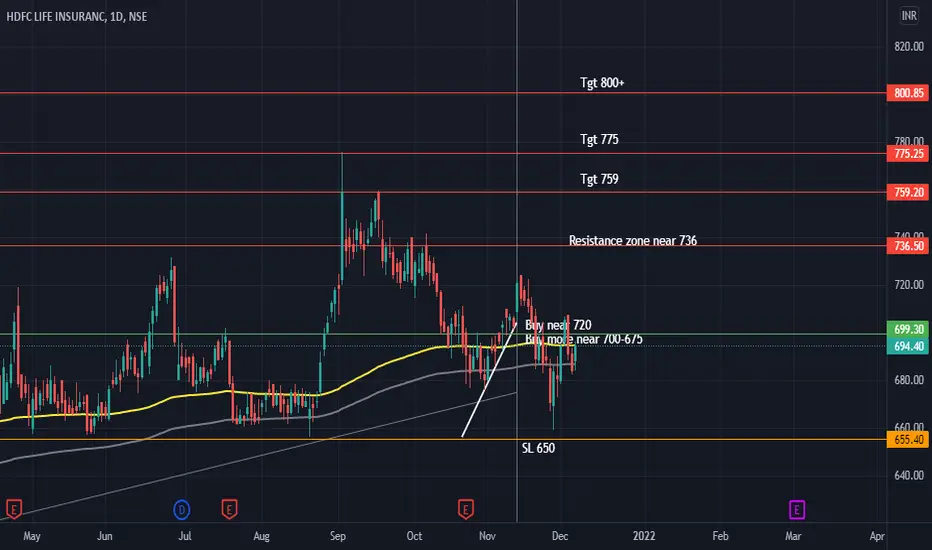
HDFC LIFE INSURANCE (LONG)HDFC Life insurance is following trendline beautifully
Taken support at 650-675-700
Buy near 720
Buy more to Avg out at 675-700 if it comes
Safe to buy between 675-700 only
Keep SL 650
Tgt 759-775-800-1000+
Please do analyse yourself also on charts. It is for educational purpose only. Must consult with your financial advisor before investing.

HDFC life - Inverse H&S breakoutThe stock has broke out after forming Inverse Head & Shoulders after a downtrend indicating change in direction
High volumes on breakout.
Look for a small retracement to enter with a small SL.
Trade at your own risk!!!
For educational purpose.

Go long for hdfc lifeHdfclife has given Breakout with good volume. Results of this stock was good. So go long

HDFC Life Insurance Company Ltd - 01.11.2021HDFC Life Insurance Company Ltd
The stock has a MACD Bullish Divergence in Daily Chart
Prices are at Ema
The stock is trading @ 690 levels
Let the prices go above 705
Watch out for the price actikn

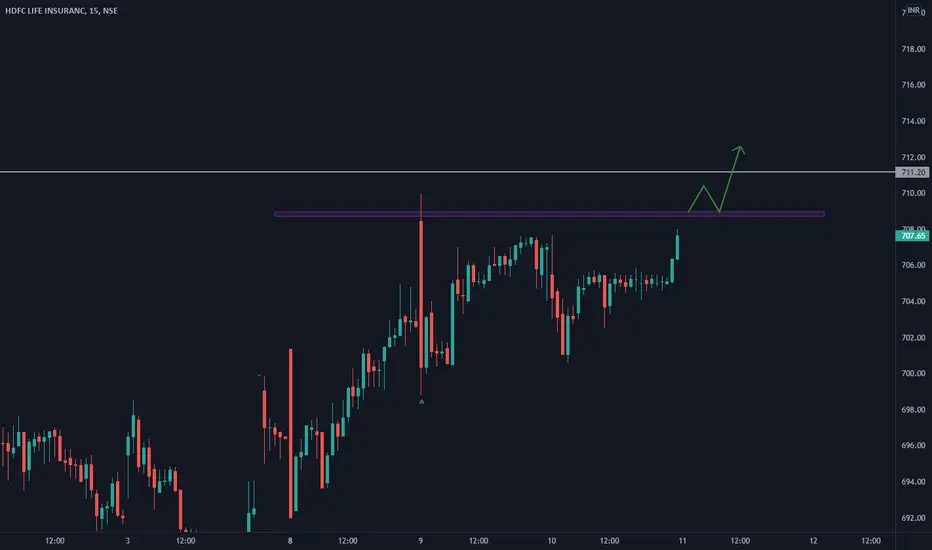
HDFC LIFE BREAKOUT STOCK 20/10/21HDFC life is Trading Just ABOVE 1.19% DMA
and in 15 min Time Frame it is Trading in FLAG PATTERN
and Yeaterday it had Broken Falling wedge
Levels for 20/10/2021
buy above 705 TGT-1 709 TGT-2 711 TGT-3 713 TGT-4 715 Max 720 (Week TGT-738/750)
sell below 702 TGT-1 699 TGT-2 696 TGT-3 693 TGT-4 690 Max 685 (Week TGT-686/673)

HDFCLIFE - Stock for tomorrowHDFC Life recovery from 690 levels, is quite interesting and the stock looks good on most of the timeframes.
For tomorrow, if it sustains above 700 levels, it would be mostly moving towards 715 levels and above.
SL around 697 levels.

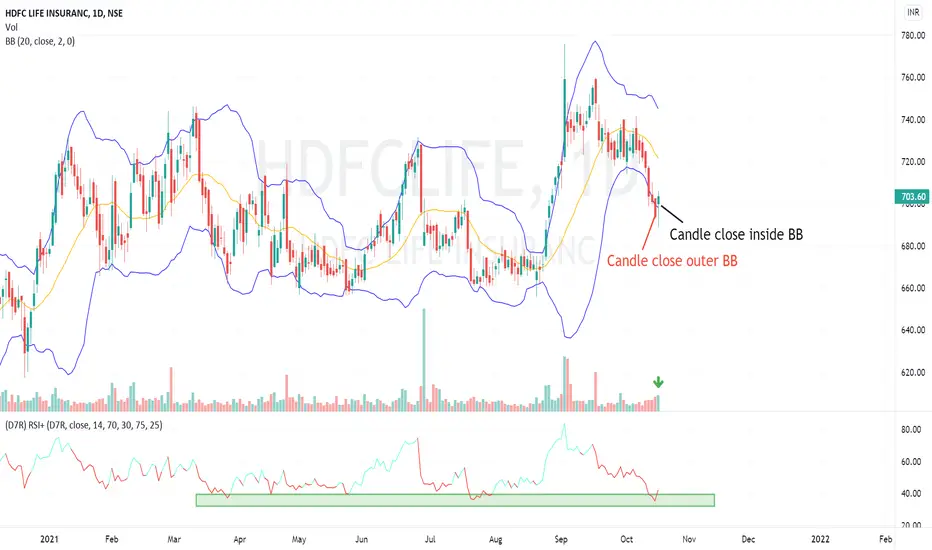
HDFCLIFE - reversal candidate Reversal of polarity through Bollinger bands.
The current down trend has been negated today, with greater than previous day bull volumes & Pin bar formation.
Also, RSI has bounced from the DD zone.
Accumulation in HDFCLIFEHDFCLIFE is a pretty bad stock from a fundamental perspective. But from the VSA we can see that the institutions are finding some value in it. It's almost debt-free and has reported 513cr of income from some other source. It's in a testing phase. It would be a really good buy if there's a sudden upthrust.

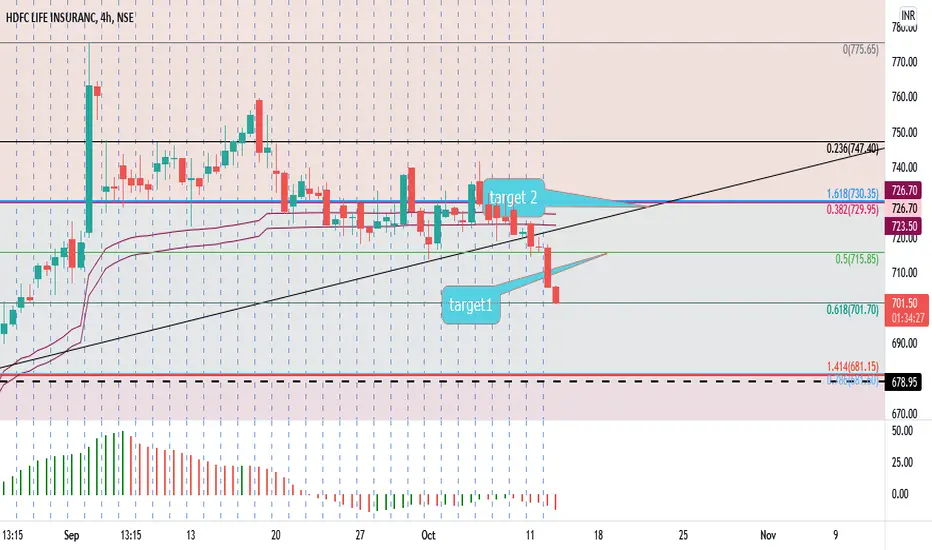
hdfclife buy ideahdfc life trading around support area, a buy can be initiated with a buy the dip strategy from now every 2% dip, for target of recent high 775 with a long term view, for short term 715 and 722 with stop of 689 daily close.
HDFCLIFE at make or break level..HDFC LIFE may get trendy in either side.. after breaking consolidation phase...

HDFCLIFE support and resistance trend line since 2018Analysis on HDFCLIFE.
Testing its trend support and resitance line around 5 times.
Taking the resistance line (range btw March to August) as support line.

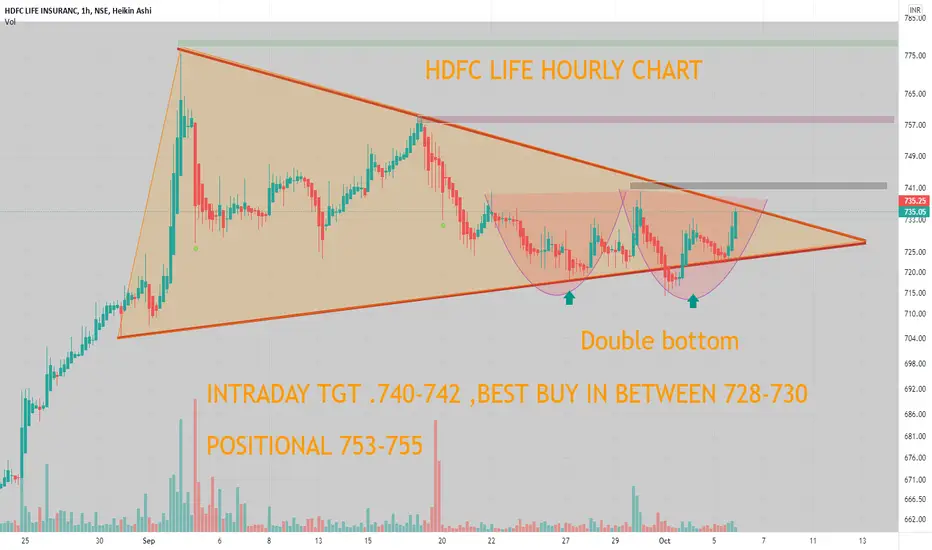
HDFC HOURLY CHART Triangular pattern along with double bottom , intraday tgt 740-742 . positional 753-755
HDFC LIFEHDFC LIFE FACING ...HORIZONAT RESITANCE and Tren Resistance...downside will be open if it will break 725........for target 695-700............
