Hero Motor Corp | Elliott Wave Analysis | Learn with me...Wave Analysis:
Within the completed fifth wave, we can see that the corrective wave II has completed a WXY correction, which is a complex correction pattern consisting of two zigzag corrections and a connecting wave. The internal degree 1 wave within the WXY correction has also completed, indicating a potential uptrend.
Currently, the stock is in the early stages of the second wave, which is a corrective wave. It has completed the internal degree 1 wave, which consisted of a zigzag correction. However, the corrective wave is likely to continue, and the stock may find support near the 2500 level.
In conclusion, Hero MotoCorp has a strong long-term trend and is currently in a corrective wave, which is likely to find support near the 2500 level. Traders and investors should keep a close eye on the stock's price movements to identify potential entry and exit points.
Thank you for your love and trust...!
HEROMOTOCO trade ideas

HeromotocoHeromoto breakout weekly trendline, with in a month or 2 month expecting to reach 4100 target

Heromotoco Simple Price action Analysis BullishNSE:HEROMOTOCO was in Down Trend in the past and now it has started creating HHs and HLs in the candlestick chart, this is a signal of an ongoing Up-Trend.
As long as the last HL is holding price should go up and make a new HH in this chart. I have used the Channel tool to find out the right Target for now.
The expectation is Price will go up to 3400 i.e., an approximate 11% Return on Investment in quick succession.

Heromotocop good cup and handle Its on the breakout of longterm trendline in weekly chart and also cup and handle breakout. Just study the chart how it appears beautiful.just learning purposes no recommendation

HEROMOTO range breakoutinside bar and then range breakout of 170 points....can be add for 350pt target which is 3440
cmp 3098
target 3180 : 3430
sl 3038

Hero of 3x Triple Curves formationHero of 3x Triple Curves formation
Reason:
1) Triple curves
2) Double bottom can be easily seen
3) Again small curve is forming recently, that means more buying is going by FII DII.
Target is 5900.

Right time to take short position in Hero Motocorp
Hero is hitting strong High price level. Should we take short position ?

Heromotoco - Elliott Wave CountHeromotoco - Elliott Wave Count
Heromotoco - Ready for 2900.. the market appears to be completed the Wave B and we can expect wave C with the target of 2900 and below. please note that if the market cross above 3188 which is our SL, the view considered as invalid.
Please note that this information is solely for educational purposes, and it is essential to exercise caution when trading.
NSE:HEROMOTOCO BSE:HEROMOTOCO NSE:HEROMOTOCO1!

Resistance Breakout - HEROMOTOCORPPlease look into the chart for a detailed understanding.
Consider these for short-term & swing trades with 2% profit.
For BTST trades consider booking
target for 1% - 2%
For long-term trades look out for resistance drawn above closing.
Please consider these ideas for educational purpose
Please note that, if there are some big targets, those are drawn thinking for long term.

Heromotoco - Elliott Wave CountHeromotoco - Elliott Wave Count
Heromotoco - the market violates our bearish view which we posted earlier. Hence this might be an alternate view on Heromotoco. however, its recommended to open short position only if the market breaks above channel and comes back closed inside.
Please note that this information is for educational purposes only, and it is crucial to trade with caution.
NSE:HEROMOTOCO BSE:HEROMOTOCO NSE:HEROMOTOCO1!

Heromotoco - Elliott Wave CountHeromotoco - Elliott Wave Count
Heromotoco - The market appears to be in correction. it seems that Wave B is near completion and Wave C expected to begin with the targets below 2850 level and consider 3244 level for invalidation to this view.
Once the ABC correction is completed we can expect the next impulse up move.
Please note that this information is for educational purposes only, and it is crucial to trade with caution.
NSE:HEROMOTOCO BSE:HEROMOTOCO NSE:HEROMOTOCO1!

HeromotoCMP: 3100.85
If stock price 3181.10 upper candle day closing And retest than see bullish movement See in future !
These are swing idea's which you can add your watchlist and analysis for yourself.
Keep on radar.
This content for only education purpose!
I am not SEBI Register.

4000 is on its way?📈 Heromotocorp Weekly Analysis 🏍️
July's breakout from the 2-year resistance channel ✨
August saw a retest of the breakout zone. 🔄
Now gearing up for a potential rally, eyeing the 3984 target. 🚀
🚨 Key Levels Alert 🚨
🔴 Red Zone: Multi-year resistance range to conquer.
🟡 Yellow Zone: Akin to the green support area; aiming to surpass it.
🎯 Once both are cleared, it's onward to 3984. ⏩
Estimated timeframe: 8-12 months, but early action is possible. ⏰

Hero motocorp ready for fresh upside For all trade on my Auto Harmonic patterns indicator trade setup -
Risky trades can take trade after crossing 23.6% on either side and safe traders can take trade after 41% We can start buying when our Trailing SL hit at 23.6% with SL of recent low our Target will be 41%, 78.6% , 127.2% 161.8% and 223.6 % , when reversal pattern appears on chart we have to trail our SL if trailing SL hit exit from long trade and initiate sell trade ,

$HEROMOTOCO 2R Long ideaNSE:HEROMOTOCO building up liquidity.
the OB over here should be a good entry to grab all the Sell side liquidity and take the stock to test its recent highs. even though this is a 2 R trade idea i am publishing this as we are sitting so close to ATH . with their release of Kharizma bikes and delivery of harley tieup x440 coming up. this stock should do good if they keep the momentum.


Heromotoco - LongNSE:HEROMOTOCO BSE:HEROMOTOCO
Heromotoco - upside move expected up to 3100 range
short term uptrend - so be caution while taking long position.

RISK OF 2.5% IN NSE:HEROMOTOCORPfor GAINING atleast 13.5%, NSE:HEROMOTOCO is in rally for past 5 months and expecting it to continue it's rally until it reaches the ATH (fundamental view : expecting rise in revenue by HARLEY-DAVIDSON partnership) and it also respected the valid DEMAND ZONEs in the past. 2862.50 or below it could be the best price to enter the trade and the target could be recent swing high or the ATH of 4091.

HEROMOTOCO ABOUT TO START ANOTHER RALLY?Descending channel has been formed on HEROMOTOCORP breakout of the channel is expected as it is currently at the trendline from which it has bounced multiple times.
TP1 - 3076.60
TP2 - 3225

Hero Moto LongChart is self explanatory. Please follow the price action & take the trade as per your appetite.
The information provided here is only for educational purpose. The information provided here is not intended to be any kind of financial advice, investment advice, and trading advice. Investment in stock market is very risky and trading stocks, options and other securities involve risk. The risk of loss in stock market can be substantial. Moreover, I am not a SEBI registered analyst, so before taking any decision or before investing in any Share consult your financial advisor and also do your analysis and research.
Request your support and engagement by liking and commenting & follow to provide encouragement.

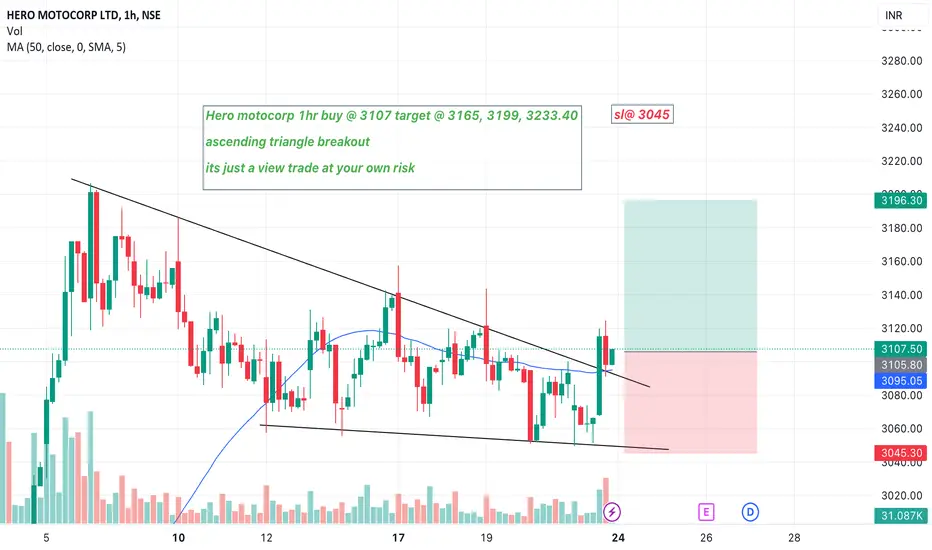
Hero motocorp 1hr buy @ 3107 target @ 3165, 3199, 3233.40 Hero motocorp 1hr buy @ 3107 target @ 3165, 3199, 3233.40
ascending triangle breakout
its just a view trade at your own risk
sl@3045
#HEROMOTOCO... good in coming session#HEROMOTOCO...
Intraday as well as swing trade
All levels given in charts ...
IF good potential seen then we work in options also
if activate then possible a good movement Keep eye on this ...
We take trade only when it activates...
Possible to give good target
TRADING FACTS

heromotocoheromotoco making a triangle on weekly time frame we can expect a good upmove after breakout of this pattern
