Hindalco in uptrendHindalco is in uptrend, A trend-up channel has been created in this picture, kindly follow this trend channel, if this channel breaks in down side then a sharp correction occurs in this share because Nifty is in downtrend from 4 weeks.
HINDALCO trade ideas


Hindalco Industries: Analyzing the Potential Upside MomentumHindalco Industries, one of India's leading producers of aluminum and copper, has been on the radar of many traders and investors lately. Analyzing its daily charts reveals intriguing patterns, hinting at a potential bullish move ahead.
Technical Analysis:
Taking a closer look at the daily charts, it appears that Hindalco has undergone a corrective phase, with the recent bottom at around 495 marking the end of the fourth wave down. For Elliott Wave theorists, this suggests the possibility of the stock entering into the fifth wave, typically associated with significant upward momentum.
The Elliott Wave Theory suggests that markets move in repetitive cycles or waves, consisting of impulsive and corrective phases. The fifth wave is often characterized by a strong surge in price, as bullish sentiment takes over.
Price Target:
Based on this analysis, it's reasonable to consider a potential price target for Hindalco Industries. If indeed the stock is poised for a fifth-wave rally, it could target a significant upside movement, potentially reaching levels around 635.
However, it's important to note that technical analysis provides probabilities, not certainties. While the Elliott Wave Theory offers valuable insights into market behavior, it's essential to supplement it with other indicators and risk management strategies.
Risk Factors:
As with any investment opportunity, there are inherent risks to consider. Market volatility, economic factors, and unforeseen events can all impact the trajectory of a stock. Additionally, individual stock performance can be influenced by sectoral trends and company-specific developments.
Conclusion:
In conclusion, the daily charts for Hindalco Industries present an intriguing opportunity for traders and investors. With the recent corrective phase potentially ending and the possibility of a fifth-wave rally on the horizon, there could be significant upside potential for the stock.
However, it's crucial to approach this opportunity with caution, conducting thorough research and employing risk management strategies. While technical analysis can provide valuable insights, it's essential to consider a holistic view of the market and remain vigilant to changing dynamics.
As always, investors should consult with financial professionals and conduct their due diligence before making any investment decisions.

Does $NSE:HINDALCO will Take Support ?Dear Followers,
I hope this message finds you well. I wanted to provide you with a brief update on the stock NSE:HINDALCO I have been monitoring.
It appears that the stock is approaching a potential Support level Near 495-500 This is an important technical point where the price has historically had difficulty breaking through. It suggests that we may see a temporary halt in the current Downtrend momentum and Possibly it will test 550-560 In Upmove.
Resistance Levels to Watch out.
Resistance levels are the opposite, representing prices at which a stock has historically struggled to move above. These levels can signal a selling interest. Understanding resistance points is crucial for anticipating potential obstacles in the upward movement of a stock.
R1= 510
R2= 530
R3= 560
Support Levels To Watchout.
Support levels represent prices at which a stock has historically had difficulty falling below. These levels often indicate a strong buying interest. It's important to monitor these levels, as a breach might suggest a potential downward trend.
S1= 495
S2= 480
S3= 455
As always, please remember that investing involves risks, and it's important to carefully consider your options. If you have any questions or would like to discuss this further, please don't hesitate to reach out.
Best regards,

HINDALCO--DemandZoneThis stock price is now near its demand zone.
A strong fall is noticed from the resistance zone @620.
on bottom side we have also trendline pushing the price upwards and acting as support.
Find long oppurtunities in this stock from trendline or demand area.

Hindalco possible reversal zoneHindalco possible down move expected till 540 level, then can expect a reversal from there
NOTE: I am not a professional investor; I have only two years of experience in stocks and investing. Please refrain from making any trades based on my chart analysis, as this is solely for community learning purposes.


HINDALCO 20% UPSIDE TARGETHindalco Stock looks good for a 20%+ Upside target, this stock currently moving in a ascending tringle, if it breaks we see a bullish momentum continue to its ATH.

Clear Support. Super up TrendHindalco ha been following a great trend line and it's likely to go even higher. A small stop loss below trend line and a favorable 10-12% Return in a month or so is very much possible.
I do not give but still recommendations and i am always learning 😬😎

Long HindalcoBuy- 585.45
SL - 582.25
Target- 591.85
Its a very big move.
Always check the sentiments of the market as per technical analysis,
Best of luck to all traders.
You are responsible for your Profits and loss, Shared for Educational purpose

HINDALCO - LONG TERM ANALYSISHINDALCO is moving in a SYMMETRICAL TRIANGLE
A good opportunity in HINDALCO either we for long / short by seeing the break out accordingly...
For the time being wait and watch.
Follow the levels, I have given above chart
Disclaimer - All information on this page is for educational purposes only,
we are not SEBI Registered, Please consult a SEBI registered financial advisor for your financial matters before investing And taking any decision. We are not responsible for any profit/loss you made.
HAPPY TRADING GUYS

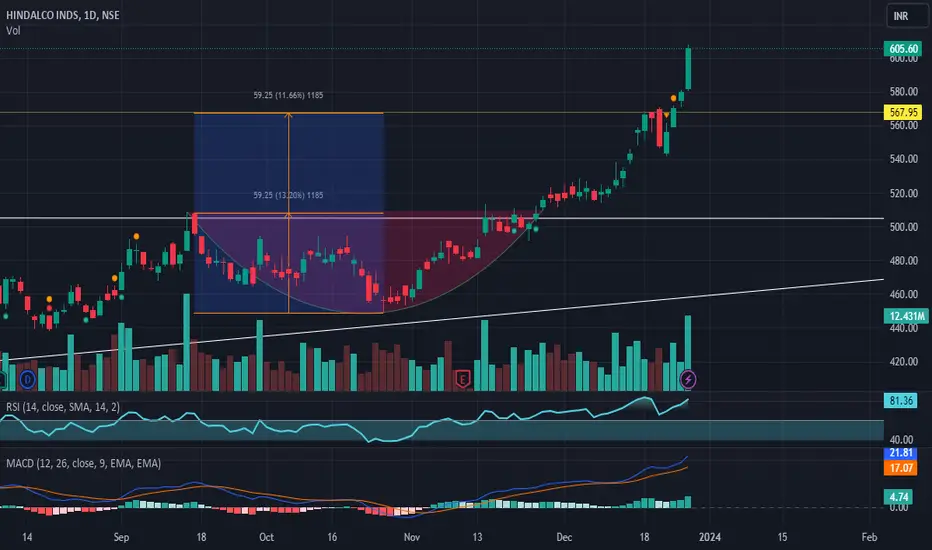
CUP AND HANDLE PATTERN JUST LOOKING LIKE A WOWWPleasure to have you here. This is an analysis done for the Tickr, and potential in the Technicals.
In this Chart ,which has been slightly in uptrend.
if you like the idea please like the post :) It will be a motivation to further such ideas.
Disclaimer Note:-
1) This is just an analysis setup and no advice to trade/trade
2) If you are making position, please have your risk to reward analysis and then enter.
3) The analysis and target shared does not mean i trade in them, entry and exit depends on the market open and other factors.
HINDALCO .. READY FOR GUD TARGETHindalco is given gud triangular pattern break out with gud volume supported by key moving average. Also confirming my favorite double bottom pattern.
And also satisfying all the condition of break out.
1. big break out candle.
2. Gud volume
3. No seller wick( opposite party respose)

Simple profit Booking levels for Positional playersHey Folks..! Hope you all had a great year and i wish you have a wonderful year ahead...
I have marked all the profit booking levels for the year, anyone who is holding any positions should be cautions at these levels...
In case you have a bullish view that treat these levels as a further breakout levels...
This analysis is my personal opinion and do not consider as an investment advice.

BPCL SWING TRADING BASED ON CUP AND HANDLE PATTERNPleasure to have you here. This is an analysis done for the Tickr, and potential in the Technicals.
In this Chart ,it is very clear example of cup and handle pattern.
if you like the idea please like the post :) It will be a motivation to further such ideas.
Disclaimer Note:-
1) This is just an analysis setup and no advice to trade/trade
2) If you are making position, please have your risk to reward analysis and then enter.
3) The analysis and target shared does not mean i trade in them, entry and exit depends on the market open and other factors.

HINDALCO DAILY CHARTHINDALCO DAILY CHART
Breakout @ 450 Target @ 827 Resistance @ 550
HINDALCO has witnessed a trendline breakout @ 450 levels, medium target projected @ 827 levels.
Its only an observation & not any suggestion.


HINDALCO--@Resistance Zone??this stock is trendling Upwards..
now the price is at Resistance Zone...
if it failed to break the resistance it will continue its fall,
on bottomside trendline is acting as a support.
keep in long side as long as price is above the trendline..
On top side after a strong fall price is going to test the resistance, so keep looking for short from this zone.
Now at resistance, multiple times it is rejected from this resistance, this time if this breaks it will reach the resistance zone at 580 levels.
Trade safe...

HINDALCO📢Resistance broken stock📢
These are swing ideas which you can add your watchlist and analysis for yourself !
Keep on your radar!
This content only education purpose!
❗I am not sebi ragister❗

HINDALCO - 10 months CUP & HANDLE══════════════════════════════
Since 2014, my markets approach is to spot
trading opportunities based solely on the
development of
CLASSICAL CHART PATTERNS
🤝Let’s learn and grow together 🤝
══════════════════════════════
Hello Traders ✌
After a careful consideration I came to the conclusion that:
- it is crucial to be quick in alerting you with all the opportunities I spot and often I don't post a good pattern because I don't have the opportunity to write down a proper didactical comment;
- since my parameters to identify a Classical Pattern and its scenario are very well defined, many of my comments were and would be redundant;
- the information that I think is important is very simple and can easily be understood just by looking at charts;
For these reasons and hoping to give you a better help, I decided to write comments only when something very specific or interesting shows up, otherwise all the information is shown on the chart.
Thank you all for your support
🔎🔎🔎 ALWAYS REMEMBER
"A pattern IS NOT a Pattern until the breakout is completed. Before that moment it is just a bunch of colorful candlesticks on a chart of your watchlist"
═════════════════════════════
⚠ DISCLAIMER ⚠
The content is The Art Of Charting's personal opinion and it is posted purely for educational purpose and therefore it must not be taken as a direct or indirect investing recommendations or advices. Any action taken upon these information is at your own risk.

Hindalco ready for 500 + on Upside On Our Harmonic pattern indicator based trade setup take trade as explained below :-
Early trades Buy or sell below/ above 23.6 %, safe trades buy or sell above / below 41% , after taking trade next upside or downside levels will be target ,
When reverse buy or sell signal appear then book profit on Target or trail SL to 23.6 % If trailing SL hit then early trade can be taken above or below 23.6 and safe trade can b taken above/ below 41% ..
Please note:-
It's working on news based and volitile market very well so exit if SL hit

hindalco 1w time frame buy@ 444 target 470, 480, 490, 495.75 hindalco 1w time frame buy@ 444 target 470, 480, 490, 495.75
ascending triangle breakout
risk reward 1:2
sl @418

HINDALCO SWING TRADE !!Hindalco is going as per the triangle pattern... should have published it earlier but we can still go long in this ... risk management is necessary
SL is very small 467.00
