HINDPETRO - long viewA good time to invest in this counter.
Total Revenue 2,77,873.49
Financial Year FY 2019
Total Revenue 2,70,773.15
Financial Year FY 2020
Total Revenue 2,36,030.84
Financial Year FY 2021
Total Revenue 3,53,810.15
Financial Year FY 2022
PE Ratio: 4.28 compared to sector PE Ratio of 13.09
Expectations: Higher returns, Higher revenue growth, Lower earnings,
Results: Revenue growth - Higher than Industry, Net Income - Higher than Industry, Market share - Increasing over the past 5 years
Current price is less than Intrinsic Value which indicates there could be increase in price
Good time to enter the stock
Buy above 228 for an immediate target of 244
Buy above 228 for an short term target of 274
Buy above 228 for an medium term target of 332
Buy above 228 for an long term target of 450
Stop loss of 8-10%
Stock faces immediate resistance in the area of 234-237, the next level of resistance is 259, further we have 306-311 before the last 2 resistances at 332 and 354
HINDPETRO trade ideas


Hind Petro Approaches ResistanceHindustan Petrol is entering into resistance at levels of 300. If this is breached it looks good for a target of 340. The next week remains crucial to breach the resistance. I will wait for retest before entering long position.
This is an educational analysis. Will revisit this in a week or so.


HINDPETRO LONGhindpetro long trendline brealout
bullish candle breakout also '
this is edutional purpose only


HPCL ReversalThe stock has reached lower trendline and may undergo a reversal rally. Trade is supported by brokerage calls and Supports Nearby.
Risk Reward Ratio - 2:1
SL is placed below support zone & the lower trendline. The target is placed near resistance.

Hind PetroHind Petro Bat Formation. Once hit the target fall will happen.
Disc: Only for learning purpose not a trading recommendation.

Hindustan PetrolHindustan Petrol Formed Tripple Pattern.
1) Inverted Head & Should Pattern
2) Cup & Handle Pattern
3) Cypher Pattern.
Only two pattens i have mentioned in the chart. Having more patterns will confuse the clarity of chart.
Disc: Only for internal Purpose and not a trading Recommendation.

HPCL 1. Long Buildup for Jan month /
2. Current price is less than the intrinsic value
-------------------------
3 year CAGR growth
Revenue 2.2%
NetProfit 13.9%
OperatingProfit 14.3%
---------------------------
4 8.58% away from 52 week high
5. FII/FPI have increased holdings from 18.29% to 20.19% in Dec 2021 qtr.
6.Bullish Momentum - Above Short, Medium and Long Term Moving Averages

Opportunity for Swing Trade in HINDPETROOpportunity for Swing Trade in HINDPETRO. The initial target can be around 350.
DISCLAIMER: The ideas are only for educational purposes and not buy/sell recommendation. I am NOT SEBI registered.

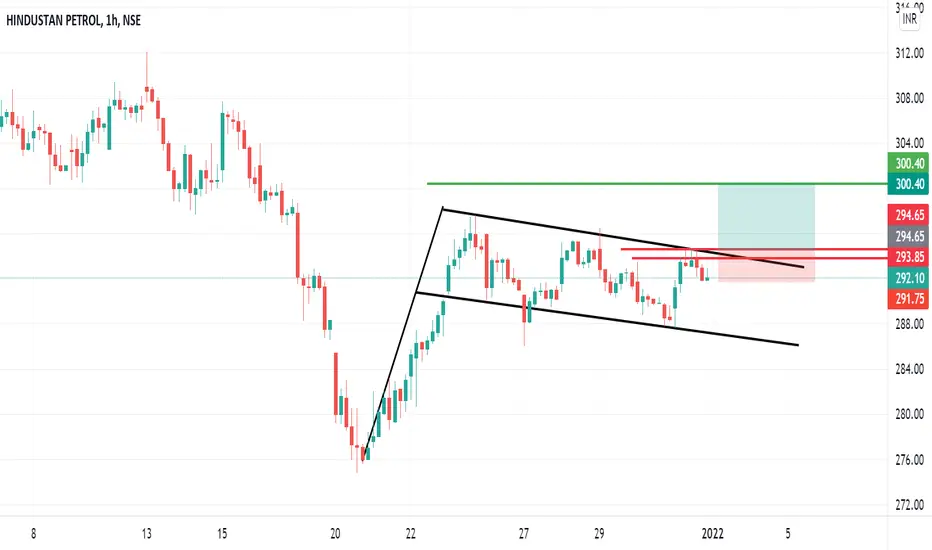
HINDPETRO AnalysisFlag and Pole in Hourly Time Frame
Resistance Zone:293-295
Upside Target:300
SL below 290
Hindpetro Trend was down and it made a good head and shoulder pattern and also showing the bearish scenario now.

[24-Nov-21] HPCL (Rs.330 now) can touch 470+ levelsRisk reward comes to 1:4
Do your research before investing

Buy HINDPETRO- BREAK THE IMPORTANT RESISTANCEPlease see the chart for more information.
Break the supply zone and retracement over the same.
STOPLOSS WEEKLY CLOSE BELOW 339.6


Stock of the week. HPCL (1/10/21)HPCL is about to give an inverted head and shoulder breakout on weekly charts . The stock has taken multiple resistance at yellow line and its about to give breakout. This is a trend reversal pattern and one can consider the stock has completed its consolidation and ready for up trend. Next targets are 400 and 500 on weekly basis. Since the stock has not given a breakout buy 50% at CMP and rest 25% & 25% in each dip. If the stock, however, trades above 310, buy remaining 50%.
Target - 400 and 500 Weekly basis.
View - Medium term.
Time - 6 months.

Hindustan PetrolHindustan Petrol is ready for the breakout of 3 years resistance line in weekly time frame

Hindpetro on 27-oct-2021These are educational ideas (targets) for hindpetro on 27-10-2021 if it crosses resistance marked with yellow line. Sharing for educational purpose.

BUY HINDPETRO ABOVE 340 SL 310 TGT 440after multiple resistence hindpetro is trying to get out of the resistence zone . buy in delivery only above 340 and keep a strict stop loss .

HINDPETRO AnalysisReasons to trade HINDPETRO: 1.Triple top pattern at weekly time frame
2. ST and MT Outlook: Long Buildup
3. Strong Financials
4. RSI>60
5. RR= 1:6.83
Watch out zone: 322-335
Upside Target: 375
Below 322 it's weak

Hindustan Petrol Bouncing Back from Support ZoneHello Trader. I am sharing my view on Hindpetro for short term. As per the technical analysis Hindpetro seems to be good stock for short term trade. One can buy the stock above 330 for the target of 360 for Swing trade and 390 for positional trade.
Before you invest please consult with your financial advisor. I am not SEBI Registered Advisor and I am sharing the idea for educational purpose.
