HINDUNILVR trade ideas

HINDUNILVRNSE:HINDUNILVR
ITS ONCE AGAIN BACK TO CRUCIAL LEVEL OF 2190
IF SUSTAINS ITS GONNA HIT 2200, 2210,2223
BELOW THAT IT FATED TO REACH 2150
*************************************************************************************************************************************************
Hi all,
Its pleasure to have you all here.
I have started putting these charts as a contribution from my side to all people who are new to business, as I had to struggle a lot without any sources at disposal. So please consider this a just small contribution from my side.
Few Honest Disclosures:
1. Any idea shared is my personal view, its not a recommendation, neither any kind of paid propaganda, so please
do your bit of research.
2. Ideas shared does not mean that I trade all or have position in them, this is just a helping hand to all.
3. I expect no comments or like nor any negativity, as I said its just a small helping hand from my side, please plan your risk and trade as per your capacity.
4. To trade in Cash, options or futures is your sole choice and your own risk
5. I am no expert in Tech Indicators, I believe in support resistance and trendline theory, you may use this as a supplement theory for better results.
6. I work for my own living, this is a hobby which I do sincerely to help anyone who might come across my charts.
***********************************************************************************************************************************************


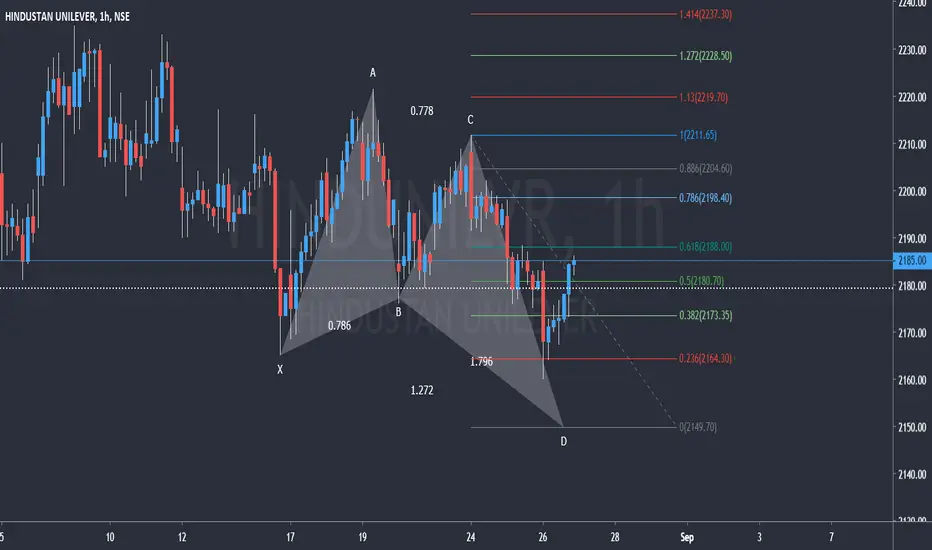
Bullish Butterfly in HINDUNILVR in 1Hour time frame.Hello,
Bullish Butterfly in HINDUNILVR in 1Hour time frame.
Note: This chart is for reference and study purpose only.
Excepting next moves in FMCG #HUL Since April only sector(FMCG) not performed compare with other sectors. we can expecting this sector will bring mark upside.


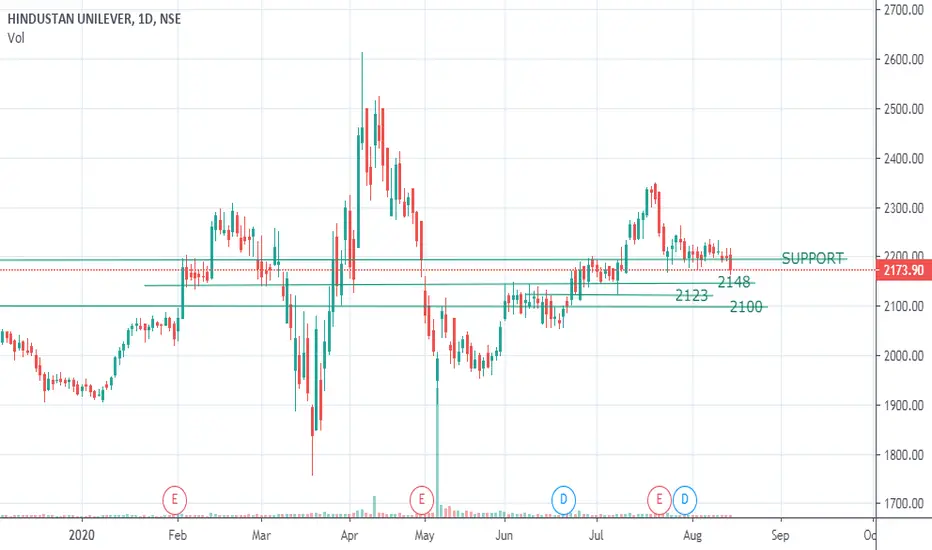
Hindustan UniLever, here you Go!HUL is the market leader in FMCG sector, completely debt free and is known to provide good returns on equity. Despite the current pandemic, it is able to maintain it's operating margins significantly.
HUL is giving a very strong signal for an upcoming trend reversal. It can move either ways forming a descending pattern. Crossovers suggest that its been selling weak lately and likely to move up. Also, it's trading at 50% retracement level. The chances are more likely that it would go up since the company is fundamentally strong. As a recommendation, I would suggest it's better to wait for a strong breakout which is technically on cards and can happen real soon.


HINDUSTAN UNILEVER Good Entry BuyI am a consultant for anyone who needs a consultant, I see that HINDUSTAN UNILEVER will rise in the next few hours when the market opens
NB:
1, When you decide to use my ideas in your trading, please contact me to inform you of some things and monitor the position together without specifying a take profit or stop loss, we will decide when to open and close the position
2 (When I set the take profit and stop loss in a number that does not mean that the price will reach it, I gave a buy or sell signal only according to the analyzes I made in the chart and delete it later, in the order to share it with you so that you have a clear picture and read it clearly, thank you!)

HUL getting ready for breakout from 2217HUL getting ready for breakout from 2217 resistance at ascending triangle top 2216

HINDUNILVRNSE:HINDUNILVR
LEVELS HAVE BEEN MARKED, PLEASE REFER CHART, FEELING LAZY TO UPDATE.
**********************************************************************************************************************************************
Hi all,
Its pleasure to have you all here.
I have started putting these charts as a contribution from my side to all people who are new to business, as I had to struggle a lot without any sources at disposal. So please consider this a just small contribution from my side.
Few Honest Disclosures:
1. Any idea shared is my personal view, its not a recommendation, neither any kind of paid propaganda, so please
do your bit of research.
2. Ideas shared does not mean that I trade all or have position in them, this is just a helping hand to all.
3. I expect no comments or like nor any negativity, as I said its just a small helping hand from my side, please plan your risk and trade as per your capacity.
4. To trade in Cash, options or futures is your sole choice and your own risk
5. I am no expert in Tech Indicators, I believe in support resistance and trendline theory, you may use this as a supplement theory for better results.
6. I work for my own living, this is a hobby which I do sincerely to help anyone who might come across my charts.
***********************************************************************************************************************************************

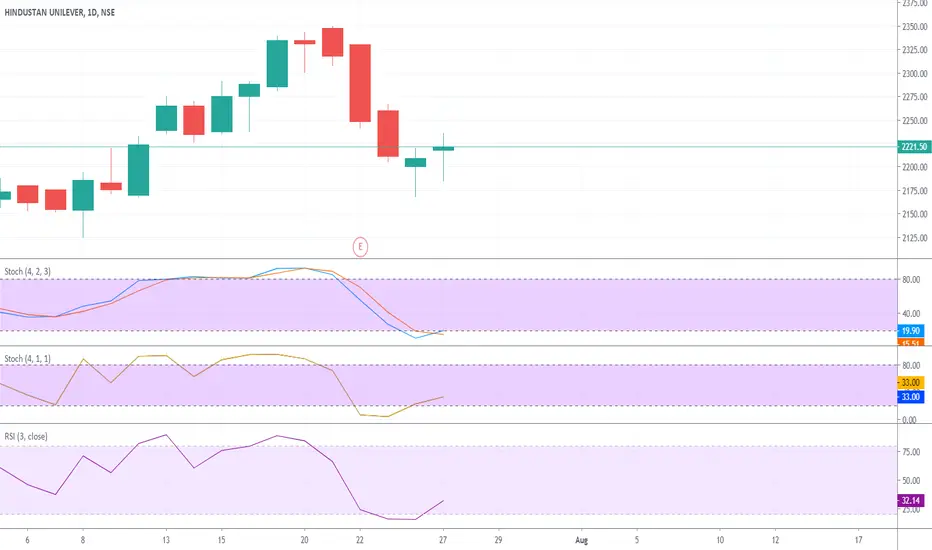
HINDUSTAN UNILEVER : NR7 candle on mid bolinger band#HINDUNILVR given +ve result on 21st July since stock is falling due to profit booking and covid19 uncertainty.
Today stock bounce back from the mid bolinger band and closed above 2191 support level. Today stock form the NR7 candle that can change into gap UP/Down opening tomorrow session.
Level 2175 is critical level if stock will break it then next support will be 2145 and 2066.
Resistance : 2300 and 2400
Breakout : 2223
LTP : 2194.55
Breakdown : 2175
Support : 2145 and 2066
(Disclaimer: This is only for educational purpose and paper treading. Learn and take advice from you financial advisor)

EVERYTIME TESTING EMA200 IS LONG OPPORTUNITY HINDUNILVR
Testing EMA 200 is a long opportunity for investors

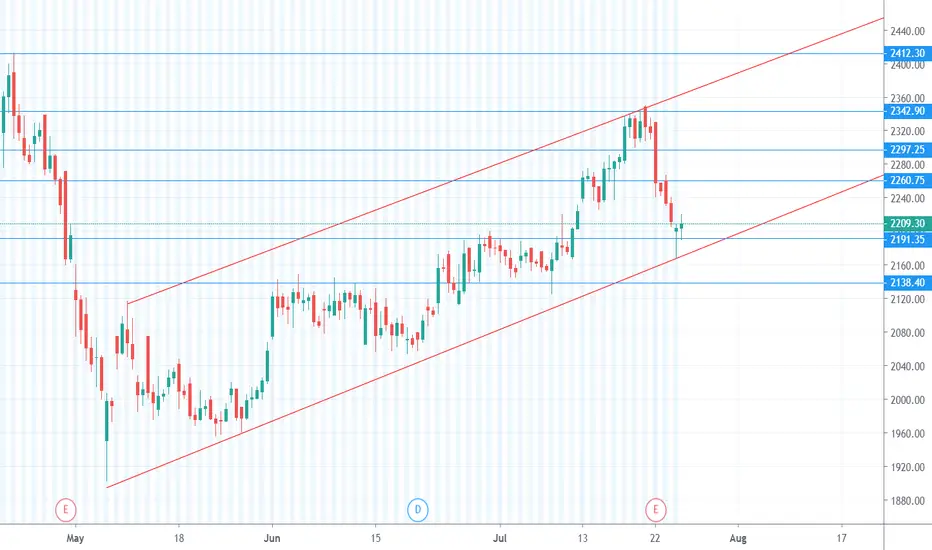
99.99% we go up !Quite close to 2190 or our point of invalidation , its been tested and had a small bounce , looks like should resume upwards from here .
Stop loss 2155 just a tad under the 200 day MA however i feel we continue up.
Checking out for an Intra opportunity .

9 days to 2310 As predicted HUL is taking small positive steps.. and this is likely to continue till it achieves 2310 level .

HUL - STOP & REVERSE ( HAMMER AT A IMP AREA )STOP & REVERSE ( TRADING IN A CHANNEL ) AND HAMMER AT SUPPORT — MORE UPSIDE .

hindustan uniliverhello friends !! #my_view hul will go up as it has sustained over the trendline. Can go for long position till it touches any support or the upper trendline #learner