HINDUSTAN ZINC LTD at Best Support !!There are two charts of Hindustan Zinc — one on the 4-hour time frame, and the second on weekly time frame.
Chart 1 (4-Hour Timeframe):
The stock is moving in a Higher High, Higher Low (HH-HL) structure, indicating a bullish trend.
Support zone is observed near the 400–410 range.
Chart 2 (Weekly Timeframe):
On the weekly chart:
the stock is approaching a major support zone in the range of ₹375 – ₹390, which has historically held strong.
If this level is sustain then we may see higher prices in HINDZINC.
Thank You !!
HINDZINC trade ideas

Trade setup HINDZINCHINDZINC Is approaching a key support level at 440. This level is critical for determining the stock's next move. A breakdown below 440 could signal increased bearish momentum, potentially leading to further downside. On the other hand, if the 440 level holds strong and shows signs of support, it could mark the beginning of a bullish reversal. In that case, there's a significant upside potential, with a possible long-term target around 655. For now, it's important to stay patient and wait for a clear signal—either a breakdown or a bounce from the current level—before making any trading decisions.

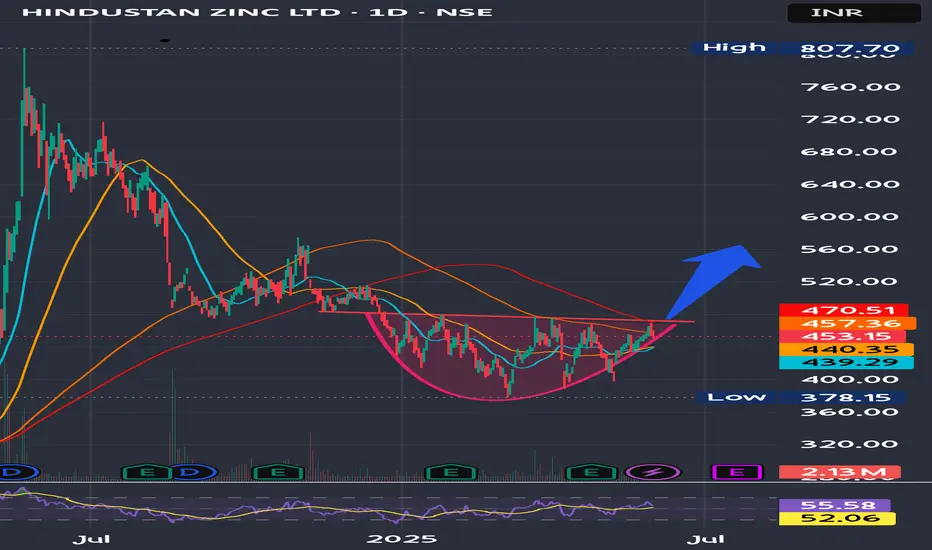
HINDZINC- Talk of the Town.🔍 Analysis:
Cup Formation:
The rounding bottom or "cup" pattern suggests accumulation and a potential reversal.
The breakout above the cup’s lip (~₹475) is confirmed with volume.
Price has tested the ₹575 zone but faced resistance.
Volume Analysis:
Noticeable volume spike during the upward breakout phase confirms buying interest.
Sustained volume will be essential for a move towards ATH (All-Time High).
RSI Indicator:
RSI at 68.53 indicates strong momentum.
RSI-based MA at 73 shows it's nearing overbought territory. A minor pullback/consolidation is possible.
Trendlines:
Downward sloping trendline (dotted) was broken convincingly—bullish signal.
Parabolic arc trajectory towards ATH (~₹807) has been drawn to project potential.
ATH Potential:
"IT CAN REACH ATH VERY SOON" is speculative but supported technically if it sustains above ₹575 and breaks it with volume.

Hind Zinc: Sitting at a major resistance Hind Zinc: Sitting at a major resistance
( Not a Buy / Sell Recommendation
Do your own due diligence ,Market is subject to risks, This is my own view and for learning only .)

HindZinc_Swing Trade_LongPrice Breaks Key Resistance with good volume.
Potential target 520 & 560.
Wait for good entry points.
Disc: Education Purpose only

HIND Zinc : Upcoming Resistance levels.
Hind Zinc : Upcoming Resistance levels.
( Not a Buy / Sell Recommendation
Do your own due diligence ,Market is subject to risks, This is my own view and for learning only .)

HINDUSTAN ZINC This stock is showing signs of a potential reversal on the weekly timeframe, based on Fibonacci retracement levels, and trendline resistance may move upwards.

Review and plan for 4th June 2025Nifty future and banknifty future analysis and intraday plan.
Positional ideas.
This video is for information/education purpose only. you are 100% responsible for any actions you take by reading/viewing this post.
please consult your financial advisor before taking any action.
----Vinaykumar hiremath, CMT


HINDZINC | Buy above 481 | SL below 450 | Target 570 ,620, 750Disclaimer:
This is not financial advice. Please do your own research or consult with a financial advisor before making any investment decisions. Investments in stocks can be risky and may result in loss of capital.

Hindustan Zinc Ltd at near breakout Hindustan Zinc Ltd. (Hindzinc) is one of the world's largest integrated producers of zinc, lead, and silver.
It is near a crucial resistance level and making higher lows indicating a breakout upwards soon.
Trading Levels-
Tgt Price-564
SL-448.5
HinduStan Zinc - Long Set-UPThe chart of Hindustan Zinc Ltd shows a bullish cup breakout on the weekly timeframe. The price has:
Broken above a long-term downtrend line
Cleared key resistance at ₹460
Formed a strong bullish candle, signaling buying interest
This suggests a trend reversal with an upside target of around ₹610, while a close below ₹420 would invalidate the setup

Technical Analysis of Hindustan Zinc - Buy & HoldLet's analyze Hindustan Zinc (HINDZINC) based on the chart.
Current Status and Observations:
Chart Type: Weekly Candlestick Chart.
Current Price: Approximately INR 455.30 (as per the blue box on the right).
Recent Action: The stock has recently broken above a "Monthly Breakout @408.90" and retested "Retest after Monthly Breakout @428.75". This indicates a bullish reversal or continuation from a support level.
RSI (Relative Strength Index): The RSI is at 47.39, which is in a neutral zone but showing an upward trend, suggesting increasing momentum.
Volume: The volume bar for the current week appears to be significant, supporting the recent upward movement.
Resistance Levels:
Weekly Resistance @482.50
Daily Target TP1 @516.50
4H Target TP2 @562.50
3H Target TP3 @590.00
Buy Price and Targets:
Given the recent breakout and retest, along with the increasing RSI, Hindustan Zinc appears to be in a favorable position for a buy.
Optimal Buy Zone: The ideal buy zone would have been closer to the retest level of INR 428.75. However, given the current price, a buy at current levels (around INR 455 - 460) is still viable, provided the breakout holds. Traders might consider buying on minor dips towards INR 445-450 if they occur.
Near-Term Targets:
Target 1 (Short-term/Swing Trade): INR 482.50 (Weekly Resistance). This is the immediate hurdle.
Target 2 (Mid-term): INR 516.50 (Daily Target TP1). Once Target 1 is cleared, this becomes the next logical objective.
Target 3 (Mid to Long-term): INR 562.50 (4H Target TP2). This level offers a significant upside potential.
Target 4 (Longer-term/Aggressive): INR 590.00 (3H Target TP3). This is the highest target indicated and suggests a strong upward trajectory if momentum continues.
Position and Duration:
Buy Position: Yes, initiate a buy. The chart indicates a constructive setup.
Hold Position with Duration:
For Short-Term Traders (Swing Trading): Hold for a duration of 1 to 4 weeks aiming for Target 1 (INR 482.50) and potentially Target 2 (INR 516.50). Monitor price action closely at resistance levels.
For Mid-Term Investors: Hold for a duration of 1 to 3 months aiming for Target 3 (INR 562.50).
For Long-Term Investors: Hindustan Zinc is a fundamental company, and if the broader market and commodity prices remain supportive, it could be a longer-term hold. For the targets shown on the chart, a duration of 3 to 6 months+ could be considered for reaching Target 4 (INR 590.00) or beyond.
Important Considerations and Risk Management:
Stop Loss: A crucial part of any trade is a stop loss. A logical stop loss could be placed just below the retest level or the monthly breakout level, for example, around INR 420-425. A tighter stop could be just below the current week's low if you have a shorter time horizon.
Volume Confirmation: Continue to monitor volume. Strong buying interest confirmed by rising volume is a positive sign.
Global Commodity Prices: Hindustan Zinc's performance is highly correlated with global zinc and other metal prices. Keep an eye on commodity market trends.
Company Fundamentals: While this analysis is purely technical, it's always advisable to have a basic understanding of the company's fundamentals and any upcoming news or events.
Market Volatility: The market can be volatile. Be prepared for fluctuations and adjust your strategy accordingly.
In summary, Hindustan Zinc presents a compelling technical setup for a buy, with clear targets in the near to mid-term. However, proper risk management with a defined stop loss is paramount.
Disclaimer: This is not financial advice. Always conduct your own analysis before trading. We are not responsible for your loss. Do your own research before buying this stock.

HINDZINC - LONGNSE:HINDZINC Weekly chart showing positive setup along with accumulation at location .

HINDZINCNSE:HINDZINC
One Can Enter Now !
Or Wait for Retest of the Trendline (BO) !
Or wait For better R:R ratio !
Note :
1.One Can Go long with a Strict SL below the Trendline or Swing Low.
2. R:R ratio should be 1 :2 minimum
3. Plan as per your RISK appetite and Money Management.
Disclaimer : You are responsible for your Profits and loss, Shared for Educational purpose

HINDZINC Trading Within Demand ZoneHINDZINC is currently trading at ₹438.25, which is above the demand zone of ₹437.35 to ₹424.2, formed on 3rd May 2024. Investors may monitor this zone for potential price retracements or consolidation before making decisions.
Disclaimer: This analysis is for informational purposes only and should not be considered as financial advice. Please conduct your own research or consult a financial advisor before making any investment or trading decisions.

Hindustan Zinc seems poised for a next impulse move.Hind Zinc: Buy at CMP
STOPLOSS: Rs. 307
It seems to have taken a support on the weekly trend line, on which it is seen forming the higher lows. With the hammer pattern near the trend line support, it appears that the retracement/consolidation after the breakout may be complete and it may start the next leg of bull rally in which the stock is in.
NOTE: The above is personal view and is for learning purposes only. Any buying/selling decisions must be based on your own analysis.

Technical Analysis of Hindustan Zinc LtdLet's analyze the technical chart of HINDZINC Ltd.
Overall Trend:
The chart is showing a strong uptrend.
The stock has broken out of a monthly resistance level at 428.75 and is now retesting this level as support.
A successful retest would confirm the uptrend and open the way for further gains.
Key Technical Indicators:
EMA (200, high): This moving average is currently at 480.52 and is sloping upwards, suggesting a bullish bias.
RSI (14, high): The RSI is currently at 69.96, which is in the overbought territory. This suggests that the stock may be due for a correction or consolidation before continuing its uptrend.
Price Action: - The stock has recently formed a bullish engulfing candle, which is a bullish reversal pattern.
The stock is currently trading above its 200-EMA, which is another bullish signal.
Support and Resistance:
The monthly breakout level of 428.75 is now acting as support.
The next resistance level is at 482.50, which is the weekly resistance level.
Trading Strategy:
Buy: If the stock successfully retests the 428.75 support level, it would be a good buying opportunity.
Stop-loss: The stop-loss can be placed below the 428.75 support level.
Target: The initial target can be set at the weekly resistance level of 482.50.
Remember: Technical analysis is just one tool in an investor's toolkit. It's always advisable to combine it with fundamental analysis and consider other factors before making investment decisions.
Disclaimer: This is not financial advice. Please consult with a financial advisor before making any investment decisions. We are not responsible for your loss because we are not SEBI registered and this analysis based on technical aspects and only for educational practice. Do your own research.
Additional Notes:
The RSI is currently in the overbought territory, which suggests that the stock may be due for a correction or consolidation before continuing its uptrend.
It is important to monitor the price action closely and adjust your trading strategy accordingly.
Let me know if you have any further questions or would like to discuss specific aspects of the chart in more detail!

HIND ZINC reversal for NEW ATH CMP : 550
made really good base and broke out of consolidation with good volumes.
a weekly closing above 550 will solidify its base.
targets and sl shown in chart.
time frame 111 candles/6months to 1 year.
NOTE : JUST A EDUCATIONAL IDEA and NOT A TRADING, BUY/SELL IDEA/TIP.
DISCLAIMER : i hold hindzinc so view can be biased.
HAPPY DANTERAS , HAPPY DIWALI.

HINDZINC for Swing TradeHINDZINC has given trend breakout on daily timeframe, above the support zone with two targets identified for Swing trade in coming days

HINDZINC BullishLooks like we are about to see a reversal pattern soon on this. Last time we added at 653 and sold at 1520. This time looking to hold for some good time.

Price at Supply zoneMultiples supports at 200 ema.
Last few days seen a volume spurt in daily time frame.
Fundamentals are OK.
FII & DII stakes are up.
NOTE: I do my analysis, do yours before trade.
Eat🍜 Sleep😴 TradingView📈 Repeat 🔁

Hindustan zincPrice consolidating near it's trend line
If It could manage to breakout then the trend will change
