7.70 INR
80.41 M INR
1.07 B INR
About AGI GREENPAC LTD
Sector
Industry
CEO
Hanskumar Shamji Shah
Website
Headquarters
Mumbai
Founded
1985
ISIN
INE0GYI01028
FIGI
BBG01GWSMH86
Hemant Surgical Industries Ltd. operates as a pharmaceutical company. It engages in the importing, manufacturing & marketing surgical and pharmaceutical products. Its products include JMS Products, Healthcare Products, Dialysis Products, Surgical Disposable Products, Criticare Products, Radiology Products, Diabetic Foot Care Products and Ophthalmology Products. The company was founded by Hanskumar Shamji Shah in 1985 and is headquartered in Mumbai, India.
Related stocks
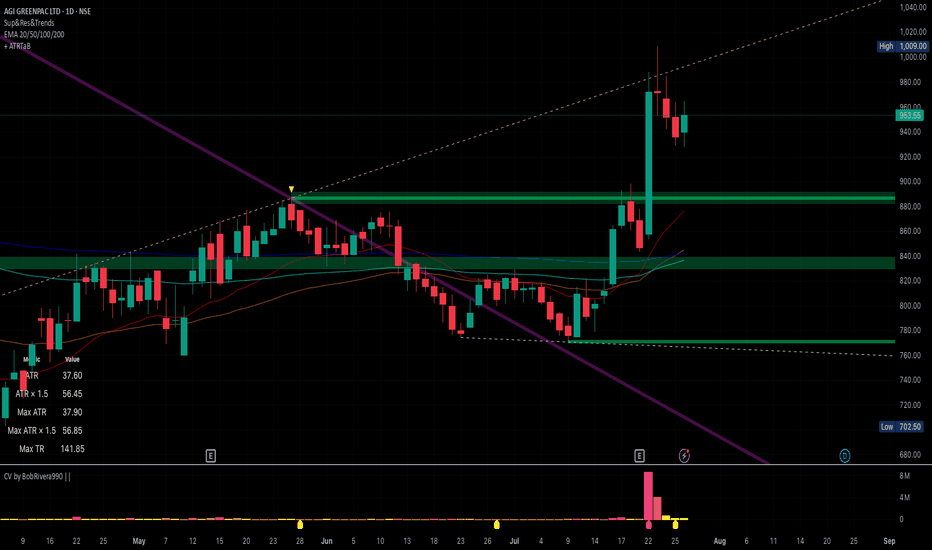
AGI GREENPAC LTD S/RSupport and Resistance Levels:
Support Levels: These are price points (green line/shade) where a downward trend may be halted due to a concentration of buying interest. Imagine them as a safety net where buyers step in, preventing further decline.
Resistance Levels: Conversely, resistance levels (re
AGI CMP 1030.AGItrading at 52 week high zone.And trading above all Short Long bullish Moving Averages.On daily basis a strong White Morubozzu candle with massive volume showing possiblities to break its Lst all time . Last year in same quarter it have tried two time to break these levels.All (Monthly,Weekly,Dail
AGI GREENPAC LTD S/R Support and Resistance Levels:
Support Levels: These are price points (green line/shade) where a downward trend may be halted due to a concentration of buying interest. Imagine them as a safety net where buyers step in, preventing further decline.
Resistance Levels: Conversely, resistance levels (re
AGI Greenpac Ltd view for Intraday 20th September #AGI AGI Greenpac Ltd view for Intraday 20th September #AGI
Buying may witness above 890
Support area 875-880. Below ignoring buying momentum for intraday
Selling may witness below 875
Resistance area 890
Above ignoring selling momentum for intraday
Charts for Educational purposes only.
Please follow
AGI Greenpac Ltd.*AGI Greenpac Ltd*
P&F Formation on Yearly Basis
Strong Price BreakOut & Sustained.
Continued Strong Vol Consolidation.
RSI: 1H>D>W<M. All in Bullish Zone.
EMAs: Widening Gaps amongst 20/ 50/ 100 levels on Monthly TF.
*Trail SL with Upside*
*Book Profit as per Risk Appetite*
Stable Financial wi
See all ideas
Summarizing what the indicators are suggesting.
Oscillators
Neutral
SellBuy
Strong sellStrong buy
Strong sellSellNeutralBuyStrong buy
Oscillators
Neutral
SellBuy
Strong sellStrong buy
Strong sellSellNeutralBuyStrong buy
Summary
Neutral
SellBuy
Strong sellStrong buy
Strong sellSellNeutralBuyStrong buy
Summary
Neutral
SellBuy
Strong sellStrong buy
Strong sellSellNeutralBuyStrong buy
Summary
Neutral
SellBuy
Strong sellStrong buy
Strong sellSellNeutralBuyStrong buy
Moving Averages
Neutral
SellBuy
Strong sellStrong buy
Strong sellSellNeutralBuyStrong buy
Moving Averages
Neutral
SellBuy
Strong sellStrong buy
Strong sellSellNeutralBuyStrong buy
Displays a symbol's price movements over previous years to identify recurring trends.
Frequently Asked Questions
The current price of HSIL is 212.20 INR — it has increased by 1.98% in the past 24 hours. Watch HEMANT SURGICAL INDUSTRIES LIM stock price performance more closely on the chart.
Depending on the exchange, the stock ticker may vary. For instance, on BSE exchange HEMANT SURGICAL INDUSTRIES LIM stocks are traded under the ticker HSIL.
HSIL stock has risen by 0.98% compared to the previous week, the month change is a 126.95% rise, over the last year HEMANT SURGICAL INDUSTRIES LIM has showed a 14.09% increase.
HSIL reached its all-time high on Sep 5, 2023 with the price of 260.00 INR, and its all-time low was 88.15 INR and was reached on Mar 17, 2025. View more price dynamics on HSIL chart.
See other stocks reaching their highest and lowest prices.
See other stocks reaching their highest and lowest prices.
HSIL stock is 1.94% volatile and has beta coefficient of 0.25. Track HEMANT SURGICAL INDUSTRIES LIM stock price on the chart and check out the list of the most volatile stocks — is HEMANT SURGICAL INDUSTRIES LIM there?
Yes, you can track HEMANT SURGICAL INDUSTRIES LIM financials in yearly and quarterly reports right on TradingView.
HSIL net income for the last half-year is 48.59 M INR, while the previous report showed 31.82 M INR of net income which accounts for 52.68% change. Track more HEMANT SURGICAL INDUSTRIES LIM financial stats to get the full picture.
No, HSIL doesn't pay any dividends to its shareholders. But don't worry, we've prepared a list of high-dividend stocks for you.
EBITDA measures a company's operating performance, its growth signifies an improvement in the efficiency of a company. HEMANT SURGICAL INDUSTRIES LIM EBITDA is 89.75 M INR, and current EBITDA margin is 8.42%. See more stats in HEMANT SURGICAL INDUSTRIES LIM financial statements.
Like other stocks, HSIL shares are traded on stock exchanges, e.g. Nasdaq, Nyse, Euronext, and the easiest way to buy them is through an online stock broker. To do this, you need to open an account and follow a broker's procedures, then start trading. You can trade HEMANT SURGICAL INDUSTRIES LIM stock right from TradingView charts — choose your broker and connect to your account.
Investing in stocks requires a comprehensive research: you should carefully study all the available data, e.g. company's financials, related news, and its technical analysis. So HEMANT SURGICAL INDUSTRIES LIM technincal analysis shows the strong buy rating today, and its 1 week rating is strong buy. Since market conditions are prone to changes, it's worth looking a bit further into the future — according to the 1 month rating HEMANT SURGICAL INDUSTRIES LIM stock shows the strong buy signal. See more of HEMANT SURGICAL INDUSTRIES LIM technicals for a more comprehensive analysis.
If you're still not sure, try looking for inspiration in our curated watchlists.
If you're still not sure, try looking for inspiration in our curated watchlists.


