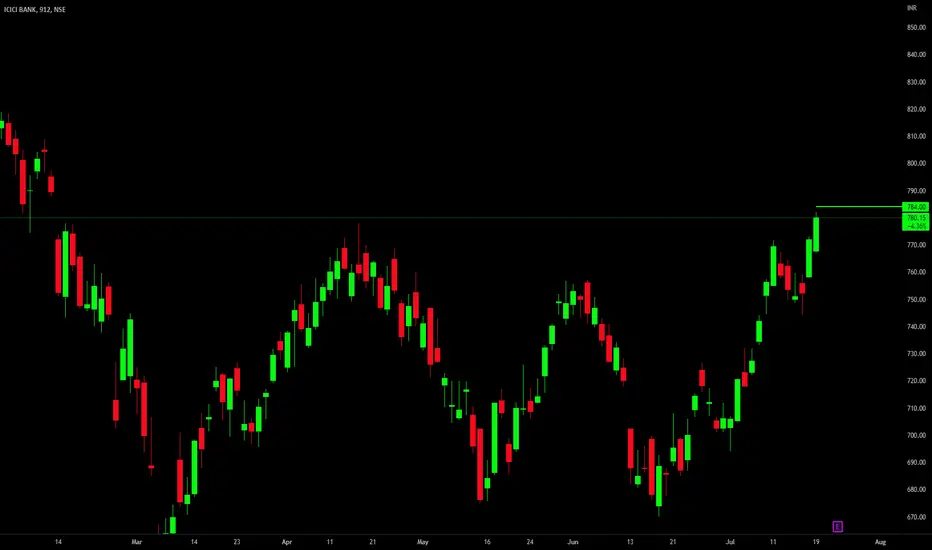
ICICI Bank Breakout IdeaICICI BANK is near breakout(4th attempt on daily chart) and the volumes are good.
CMP IS 727.
PLEASE NOTE: THIS IS NOT A TIP OR ADVICE. IT'S ONLY A TRADING IDEA. KINDLY CONSULT YOUR FINANCIAL ADVISOR.
ICICIBANK trade ideas

Looking for a scalp in ICICI BANK Will only take this trade , if i can confirm the entry when the price reaches my POI.
Don't Be the dumb money .


ICICI Bank Levels for next weekDear traders, I have identified chart levels based on my analysis, major support and resistance levels. Please note that I am not a SEBI registered member. Information shared for educational purpose. Please do take trade based on your own analysis and risk-taking abilities. Never ever worked with fixed mindset. Any news/result data may change the direction of the trend instantly. Focus on learning so you can take correct/better decision based on your analytical skills. PLEASE NOTE THAT NO ONE CAN BE 100% CORRECT. OVERALL, WE SHOULD CONTINUE TO LEARN & BE ABLE TO CLOSE IN PROFIT EVEN IF WE ARE 50% CORRECT WITH RISK REWARD RATIO 1:2
ICICI Bank levels for next week. Bank Nifty is looking weak and traders as well as investors started doing profit booking. ICICI Bank is likely to offer sell on rise opportunity with SL (Candle closing on daily chart above life time high).
Have a happy, healthy & profitable day ahead!

Icici Bank - a hidden Indian GemAs India is one of the fastest growing economies this stocks potential is very high, in the last 30 years India's economic growth has only declined in 1 of those years (COVID year) in the last 10, growth has almost doubled. With a rising economy and very strong fundamentals this seems a wise investment to hold long-term. I am looking to enter a position at the gap down around $21.41 as short-term it is in a bull flag that has potential to break out around the $26 mark. FY22 it had a profit margin of 21.58% and Debt to Assets of 9.97% respectively (17.5 Trillion in Assets) and EPS of 37.94 ending FY22 compared to 7.04 ending FY19 a sizable increase to say the least. A very strong stock in a booming Indian economy, could be a safe haven as US market has been very unpredictable IMO.

Icici bank.Lets short Looking the chart icici bank it creat the trend to near the break out wait for confarmation to short entry to make the easyable profit
In wave analysis 3rd wave was finished 4 impulsive wave formation to it could be a too long then wave 2 when wave 2 is small wave 4 is too bigger than wave 2

ICICI BANK - short position As RSI currently is around 75, we believe that it will have to cool down soon, however we expect that the price will increase a little bit more and will get rejected from the resistance level. After that, we expect that the price will decrease to retest the support.
- entry point: at the resistance level;
- target: at the support level shown in the chart;
- stop loss: above the resistance level (3,12 %).

ICICIBANKNSE:ICICIBANK
please note that we are not a SEBI Registered Investor Adviser/PMS/ Broking House.
All the contents over here are for educational purposes only and are not investment advice or recommendations
offered to any person(s) with respect to the purchase or sale of the stocks / futures and options.
You are also requested to apply your prudence and consult your advisers in case you choose to act on
any such content available as WE claims no responsibilities for any of your actions or any outcome of
such action

icicibank longicicibank today close near all time.next resistance 868 the level of resistance its break to hit another all time high.immediate support placed at 800 next support 775.to watch crucial for next week.

ICICI Bank Ltd.*ICICI Bank Ltd.*
P&F Pattern: Monthly Basis
RB Pattern: Weekly Basis
Strong Vol. Consolidation & Builtup
Price Improve. BreakOut to be Watched
Once Happen, Good to Go
*With Price Up, Trail Stop Loss*
*Book Profit as per Risk Appetite*
Fundamentally Sound / To Big To Fail Pvt. Bank.
Improving Revenue/Profitability: Yearly Basis.
Indian Macro Factors Likely to add further traction to Credit Growth: +ve for ICICI Bank.
Improved Q1-FY23 Results. Better NIM, NPA, Deposit, Loan Growth levels.
Increasing Sales/Profitability on Yrly Basis.
Satisfactory CAR levels.
Continued +ve Ops. Cash Flow
Substantial Holding with FIIs/DIIs.
*Concern:*
Slippages, Increase in NPAs
*Do Your Own Research as Well. This is Just an Opinion.*
Your Opinion may Differ/Respected.
Happy Investing :)

ICICI BANK - Short!!ICICIBANK - Corrective wave ABC ongoing.
Short the stock.
Target - 773
SL - 820
Risk aversive players can create a protective call strategy here, i.e.,
Sell futures
Buy ATM call

ICICI forming a nice bullflag in Wave 5; Min targer 890ICICI has formed a 1-2-3-4-5 impulse wave from May'20 lows. Note that Wave 2 was 61.8% retracement of wave 1 & wave 4 was 38.2% retracement of wave 3! Also, Wave 3 is way beyond 161.8% of wave 1. Also, while wave 3 broke past the pre-pandemic level, wave 4 quickly tested and bounced back from that level (550). This is a highly bullish sign.
Target for wave 5 = Wave 4 low + length of wave 3 (wave 1 length is below wave 3 high) ---- 890
After the post-earnings breakout, stock is forming a nice bull flag. Even if the flag doesnt work, after the gap is filled(765), the stock should fly. As long as stock is above 678, 890 target stays
Min target: 890
Stoploss: 678

AnalysisHere we will have a big probability of a downtrend after the breakout with force the support line and also the vwap indicator by a big candle with a large volume. But we can have a continuation of the uptrend if and only if the vwap and resistance line are forcefully broken by a large green candle and followed by large green volume.Thanks.

short option trade for july.Eicher motor, icici bank, nifty 50, and niftybank sell for the coming four days in an options trade. good setup. All the best.

breakout of neaklinebuy=786.80
target=807.20
stoploss=770.45
breakout of dubale bottom pattern;
cross the top to bottom fib. golden ratio 61.8% ;

ICICIBANK- Price Action Analysis NSE:ICICIBANK has already nearest to the PRZ level 1.272 at 805-806.
There would be higher chance of correction at this level.
BUY:
Those who have can book their profit or New buying will come when it takes the pullback up to 755.
SELL:
You can take a short after price will show any rejection.


nifty auto Sorry guys for being so late. this month's trades have not worked out as expected. huge losses but then losses and gains are part of the trade. Last month's gains have been wiped out completely. enjoy the analysis. take care All the best.

ICICIBANK - short term tradeBuy ICICIBANK @/above 784
Intraday/Short term Target 819
Stop Loss 777
Profit approx. 4%
buy after breakout and retestment. breakout trade with double bottom formation and fib. levels.
breakout trenline=777.60

ICICI bank According to yesterday analysis market has break the strong resistance level.but it gives gapup opening
