ICICIBank - Elliott wave analysis - corrective down It is in ABC zigzag correction down after completing ABC zigzag up sequence. C wave may be going to extend as further impulse. So corrective bounce of 2nd of C wave will be short sell set up.
Plz give a like if you agree with EW count.
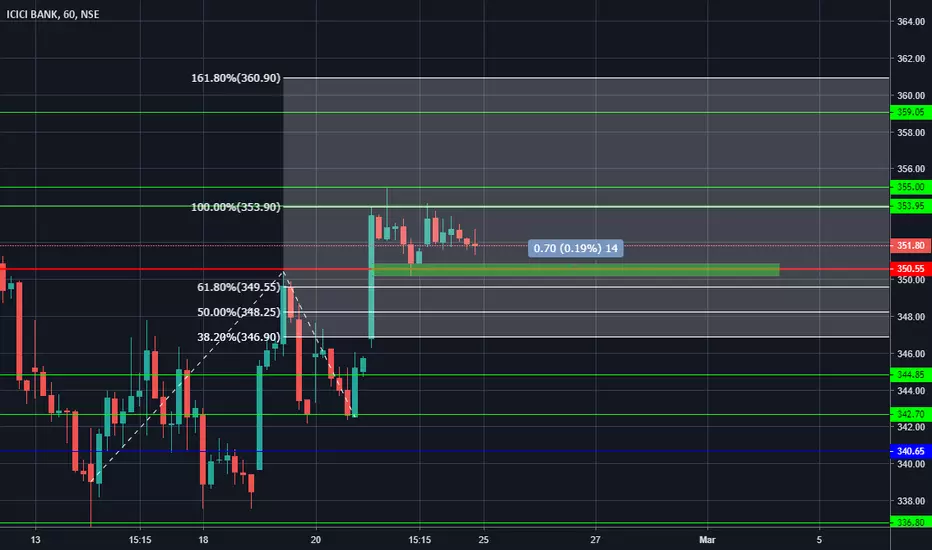
ICICIBANK trade ideas

ICICI BANK WEEKLY BEARISH BAT
price need to follow Green Trend line & hit target
If price Breaks Red Trend line is where EXIT before SL hits
POTENTIAL SELL


Icic bank 325Bank nifty continue down a week now time to bounce back I think take position icici bank near 625 with target of 640 652 with stop loss
612

At support level MACD positiveOn 30 min chart current prise at support level. MACD make positive cross over and RSI is near over sold zone

ICICI Bank SHORTICICI on 1.414 FIB and near 2.618 projection
Rejection shows weakness
Short below 650 with 675 SL
Targets 610 and 600


icici bank short and long position there is not so big deal with bank section on stocks. market is now over extended high. so market gives some retrace for grab some liquidity. atleast area is 582 and max is 527. then price go higher max area 725. stay with me for further update

ICICIBANK - Bull Flag Pattern breakout - SwingThis analysis is done purely on basis of price action and chart patterns
Analysis is done on Daily TF hence it may take few days to few weeks for price to reach the given target
Stock is has given volume supported breakout after good consolidation phase.
This is not a trade recommendation. Do your own study before entering into any trade.
Trade with your own risk & money management.
Feel Free to comment for any query or suggestion.
Do check other ideas based on similar pattern breakout. The link is below.

Why ICICI bank turned so bullish on budget day?In this analysis I applied time cycles and wave theory to undersatnd the probable trajectory of ICICI bank and find out the reason why this stock went so high. Based on my analysis I have following targets for ICICI bank.
Target 1: 670
Target 2: 730
Stop Loss: 580

Icici to reach 700 in short termIcici long term break out... gonna reach 700 soon.. long term target would b 1100


ICICIBANK | Testing RES currently at SUP | Levels mentioned in the cart | movement near SUP awaiting for Budget day


ICICI bank falling wedge patternICICI bank falling wedge pattern formed
high chances of breaking out of it if it sustains above 510
may break down below 500 for the marked area

ICICIBANK- I am not a market god to decide market movement even before market opens.
- I am Chart Pulse trader. I trade only what my chart speaks.


icici bank my positional view on ICICI BANK
Try Buy if you get 523
Sell around 576 - 596
Stop for sell 601
Targets 523 - 487
