ICICI Bank LONGICICI Bank- Set ups
MTF Analysis
ICICI BankYearly Demand Beakout 1043
ICICI Bank 6 Month Demand Breakout 1043
ICICI BankQtrly Demand Breakout 1113
ICICI BankMonthly Demand 1070
ICICI BankWeekly Demand BUFL 1170
ICICI BankWeekly Demand BUFL 1257
ICICI BankWeekly Demand DMIP 1180
Time ICICI Trade above 1257 Strong Confirmation Long
Weekly Demand Momentum Impulsive Patterns WDIMP
Daily Demand Momentum Impulsive Patterns DMIPS
ENTRY -1 1180
SL 1150
RISK 30
Taget as per Entry 1598
Points to Gain 209
Latest Last Swing High 1362
Latest Last Swing Low 1153
ICICIBANK trade ideas

ICICI UPTREND PATTERN Chart shows reversal in RSI and shows good strength in price. Good upmove may be possible from here.
CMP :1244
Target : 1350 +
StopLoss : 1205
RRR = 1:3

ICICIBANK KEY LEVELS FOR 07/10/2024//@description
// All credit goes to Tony for the concept of this indicator. His Trading View link: www.tradingview.com
// Note: The calculation method in this indicator differs from Tony's, but the concept is derived from his work.
**Explanation:**
This trading system helps you avoid blind trades by providing confirmation for better entries and exits. It considers volume, past prices, price range and indiavix.
**Entry/Exit Points:**
- **Entry/Exit Lines:** Use the BLACK line for long trades and the RED line for short trades, based on confirmation from your trading plan.
- **Stop Loss:** For long trades, set the stop loss at the RED line below. For short trades, set it at the BLACK line above.
- **Take Profit:** For long trades, target the next RED line above. For short trades, target the next BLACK line below.
**Timeframe:**
Use a 5 timeframe for trading.
**Risk Disclaimer:**
This setup is for educational purposes. I'm not responsible for your gains or losses. Check the chart for more details.

icicibank for swing/poisitional
buy near 1210
avg at 1185-80
sl at 1160 sl 4% strictly follow sl
use capital 25k to 50 k
overall risk 1k to 2k only
tgt 4% 8%12%16%20%
hold 3-6 week

ICICI BANK S/R Support and Resistance Levels:
Support Levels: These are price points (green line/shade) where a downward trend may be halted due to a concentration of buying interest. Imagine them as a safety net where buyers step in, preventing further decline.
Resistance Levels: Conversely, resistance levels (red line/shade) are where upward trends might stall due to increased selling interest. They act like a ceiling where sellers come in to push prices down.
Breakouts:
Bullish Breakout: When the price moves above resistance, it often indicates strong buying interest and the potential for a continued uptrend. Traders may view this as a signal to buy or hold.
Bearish Breakout: When the price falls below support, it can signal strong selling interest and the potential for a continued downtrend. Traders might see this as a cue to sell or avoid buying.
20 EMA (Exponential Moving Average):
Above 20 EMA(50 EMA): If the stock price is above the 20 EMA, it suggests a potential uptrend or bullish momentum.
Below 20 EMA: If the stock price is below the 20 EMA, it indicates a potential downtrend or bearish momentum.
Trendline: A trendline is a straight line drawn on a chart to represent the general direction of a data point set.
Uptrend Line: Drawn by connecting the lows in an upward trend. Indicates that the price is moving higher over time. Acts as a support level, where prices tend to bounce upward.
Downtrend Line: Drawn by connecting the highs in a downward trend. Indicates that the price is moving lower over time. It acts as a resistance level, where prices tend to drop.
RSI: RSI readings greater than the 70 level are overbought territory, and RSI readings lower than the 30 level are considered oversold territory.
Combining RSI with Support and Resistance:
Support Level: This is a price level where a stock tends to find buying interest, preventing it from falling further. If RSI is showing an oversold condition (below 30) and the price is near or at a strong support level, it could be a good buy signal.
Resistance Level: This is a price level where a stock tends to find selling interest, preventing it from rising further. If RSI is showing an overbought condition (above 70) and the price is near or at a strong resistance level, it could be a signal to sell or short the asset.
Disclaimer:
I am not a SEBI registered. The information provided here is for learning purposes only and should not be interpreted as financial advice. Consider the broader market context and consult with a qualified financial advisor before making investment decisions.

ICICI Bank ltd view for Intraday 1st October #ICICIBANK ICICI Bank ltd view for Intraday 1st October #ICICIBANK
Buying may witness above 1283
Support area 1270. Below ignoring buying momentum for intraday
Selling may witness below 1259
Resistance area 1270
Above ignoring selling momentum for intraday
Charts for Educational purposes only.
Please follow strict stop loss and risk reward if you follow the level.
Thanks,
V Trade Point

ICICI Bank in BreakoutICICI Bank NSE:ICICIBANK in Breakout. ICICI Bank in uptrend as we could see higher highs and lows in all timeframe. Buy above 1190 and Target would be 1350

ICICI Bank Showing Bullish Breakout!#ICICIBANK CMP: ₹1,318
➡️ Bullish breakout observed from an ascending channel
➡️ Volume rise supporting the breakout
➡️ Next targets: ₹1,380 on the upside

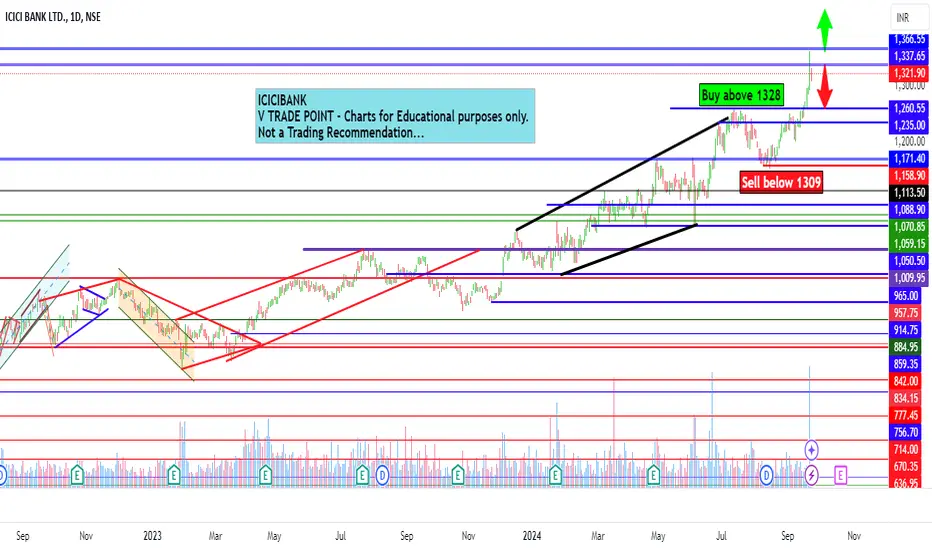
ICICI Bank Ltd view for Intraday 24th September #ICICIBANK ICICI Bank Ltd view for Intraday 24th September #ICICIBANK
Buying may witness above 1328
Support area 1308-1310. Below ignoring buying momentum for intraday
Selling may witness below 1309
Resistance area 1325-1330
Above ignoring selling momentum for intraday
Charts for Educational purposes only.
Please follow strict stop loss and risk reward if you follow the level.
Thanks,
V Trade Point
ICICI Bank Long Setup - Swing TradeICICI Bank has bullish engulfing setup and already 15m candle has sustained above the price - 1241.47 for more than 10 seconds.
Disclaimer: This is for educational purpose only and not any financial advice

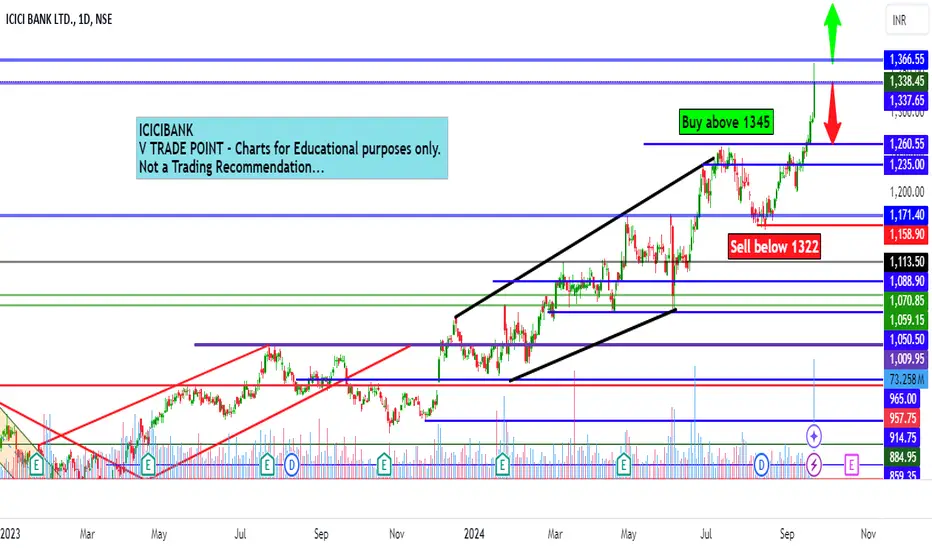
ICICI Bank Ltd view for Intraday 23rd September #ICICIBANK ICICI Bank Ltd view for Intraday 23rd September #ICICIBANK
Buying may witness above 1345
Support area 1322. Below ignoring buying momentum for intraday
Selling may witness below 1322
Resistance area 1345
Above ignoring selling momentum for intraday
Charts for Educational purposes only.
Please follow strict stop loss and risk reward if you follow the level.
Thanks,
V Trade Point
ICICI Next Potential TargetICICI has been performing consistently during the last 7-8 years. Strong trend seems to be continuing

ICICI BANK LTD S/R for 19/9/24Support and Resistance Levels:
Support Levels: These are price points (green line/shade) where a downward trend may be halted due to a concentration of buying interest. Imagine them as a safety net where buyers step in, preventing further decline.
Resistance Levels: Conversely, resistance levels (red line/shade) are where upward trends might stall due to increased selling interest. They act like a ceiling where sellers come in to push prices down.
Breakouts:
Bullish Breakout: When the price moves above resistance, it often indicates strong buying interest and the potential for a continued uptrend. Traders may view this as a signal to buy or hold.
Bearish Breakout: When the price falls below support, it can signal strong selling interest and the potential for a continued downtrend. Traders might see this as a cue to sell or avoid buying.
20 EMA (Exponential Moving Average):
Above 20 EMA: If the stock price is above the 20 EMA, it suggests a potential uptrend or bullish momentum.
Below 20 EMA: If the stock price is below the 20 EMA, it indicates a potential downtrend or bearish momentum.
Trendline: A trendline is a straight line drawn on a chart to represent the general direction of a data point set.
Uptrend Line: Drawn by connecting the lows in an upward trend. Indicates that the price is moving higher over time. Acts as a support level, where prices tend to bounce upward.
Downtrend Line: Drawn by connecting the highs in a downward trend. Indicates that the price is moving lower over time. It acts as a resistance level, where prices tend to drop.
RSI: RSI readings greater than the 70 level are overbought territory, and RSI readings lower than the 30 level are considered oversold territory.
Combining RSI with Support and Resistance:
Support Level: This is a price level where a stock tends to find buying interest, preventing it from falling further. If RSI is showing an oversold condition (below 30) and the price is near or at a strong support level, it could be a good buy signal.
Resistance Level: This is a price level where a stock tends to find selling interest, preventing it from rising further. If RSI is showing an overbought condition (above 70) and the price is near or at a strong resistance level, it could be a signal to sell or short the asset.
Disclaimer:
I am not a SEBI registered. The information provided here is for learning purposes only and should not be interpreted as financial advice. Consider the broader market context and consult with a qualified financial advisor before making investment decisions.

ICICIBank Intraday Levels: 18-Sep-24Stock made high upto 1272, then sideways momentum in last trading session. Upside Breakout drag price for up, Trendline Breakout for down side momentum. Wait for prope Price Action on levels for Entry.
Bullish> 1273
Bearish < 1263

HEAD & SHOULDER PATTERN BREAKOUTICICI BANK has broken out of a bullish head and shoulder pattern and it's now looking geared up for a good RUNUP.
Trade setup
Entry: 1250 - 1270
Stoploss: 1240
Targets: 1288 / 1345

TIME TO BUY ICICI BANK ?ICICI BANK has recently surpassed the 1250 resistance level, which also marked an all-time high for the stock. It is currently trading above this level. You can consider entering now or wait for a pullback to 1250-1255 for a potentially better entry point.

[Positional] ICICI Bank SnR IdeaNote -
One of the best forms of Price Action is to not try to predict at all. Instead of that, ACT on the price. So, this chart tells at "where" to act in "what direction. Unless it triggers, like, let's say the candle doesn't break the level which says "Buy if it breaks", You should not buy at all.
=======
I use shorthands for my trades.
"Positional" - means You can carry these positions and I do not see sharp volatility ahead. (I tally upcoming events and many small kinds of stuff to my own tiny capacity.)
"Intraday" -means You must close this position at any cost by the end of the day.
"Theta" , "Bounce" , "3BB" or "Entropy" - My own systems.
=======
I won't personally follow any rules. If I "think" (It is never gut feel. It is always some reason.) the trade is wrong, I may take reverse trade. I may carry forward an intraday position. What is meant here - You shouldn't follow me because I may miss updating. You should follow the system I share.
=======
Like -
Always follow a stop loss.
In the case of Intraday trades, it is mostly the "Day's High".
In the case of Positional trades, it is mostly the previous swings.
I do not use Stop Loss most of the time. But I manage my risk with options as I do most of the trades using derivatives

ICICI BANK LTD S/R for 17/9/24Support and Resistance Levels:
Support Levels: These are price points (green line/shade) where a downward trend may be halted due to a concentration of buying interest. Imagine them as a safety net where buyers step in, preventing further decline.
Resistance Levels: Conversely, resistance levels (red line/shade) are where upward trends might stall due to increased selling interest. They act like a ceiling where sellers come in to push prices down.
Breakouts:
Bullish Breakout: When the price moves above resistance, it often indicates strong buying interest and the potential for a continued uptrend. Traders may view this as a signal to buy or hold.
Bearish Breakout: When the price falls below support, it can signal strong selling interest and the potential for a continued downtrend. Traders might see this as a cue to sell or avoid buying.
20 EMA (Exponential Moving Average):
Above 20 EMA: If the stock price is above the 20 EMA, it suggests a potential uptrend or bullish momentum.
Below 20 EMA: If the stock price is below the 20 EMA, it indicates a potential downtrend or bearish momentum.
Trendline: A trendline is a straight line drawn on a chart to represent the general direction of a data point set.
Uptrend Line: Drawn by connecting the lows in an upward trend. Indicates that the price is moving higher over time. Acts as a support level, where prices tend to bounce upward.
Downtrend Line: Drawn by connecting the highs in a downward trend. Indicates that the price is moving lower over time. It acts as a resistance level, where prices tend to drop.
RSI: RSI readings greater than the 70 level are overbought territory, and RSI readings lower than the 30 level are considered oversold territory.
Combining RSI with Support and Resistance:
Support Level: This is a price level where a stock tends to find buying interest, preventing it from falling further. If RSI is showing an oversold condition (below 30) and the price is near or at a strong support level, it could be a good buy signal.
Resistance Level: This is a price level where a stock tends to find selling interest, preventing it from rising further. If RSI is showing an overbought condition (above 70) and the price is near or at a strong resistance level, it could be a signal to sell or short the asset.
Disclaimer:
I am not a SEBI registered. The information provided here is for learning purposes only and should not be interpreted as financial advice. Consider the broader market context and consult with a qualified financial advisor before making investment decisions.

ICICI Bank LtdImportant points marked.
*****Education purpose only*****
*****Investing in Equity is subjected to market risk do own research before investing*****

ICICI Bank Ltd view for Intraday 11th September #ICICIBANK ICICI Bank Ltd view for Intraday 11th September #ICICIBANK
Buying may witness above 1245
Support area 1228. Below ignoring buying momentum for intraday
Selling may witness below 1228
Resistance area 1245
Above ignoring selling momentum for intraday
Charts for Educational purposes only.
Please follow strict stop loss and risk reward if you follow the level.
Thanks,
V Trade Point

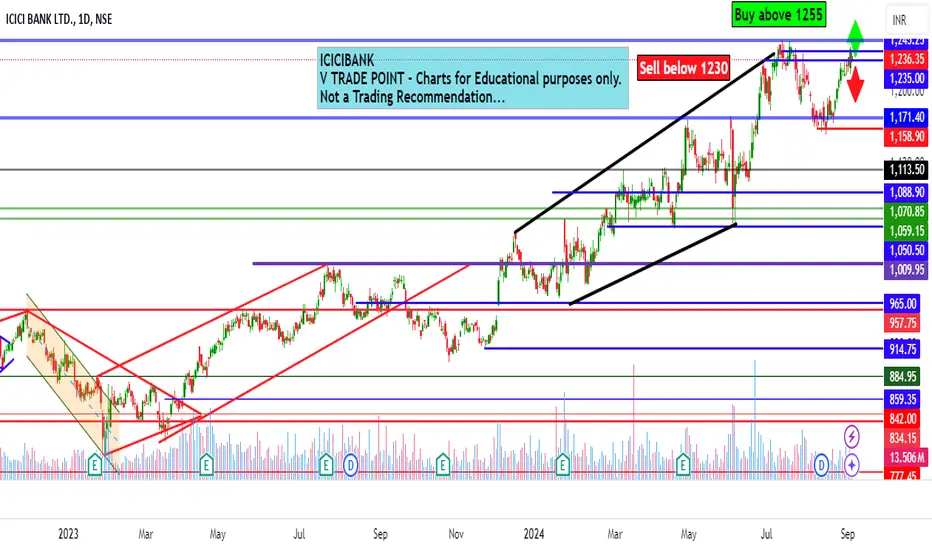
ICICI Bank Ltd view for Intraday 5th September #ICICIBANK ICICI Bank Ltd view for Intraday 5th September #ICICIBANK
Buying may witness above 1255
Support area 1230. Below ignoring buying momentum for intraday
Selling may witness below 1230
Resistance area 1255
Above ignoring selling momentum for intraday
Charts for Educational purposes only.
Please follow strict stop loss and risk reward if you follow the level.
Thanks,
V Trade Point
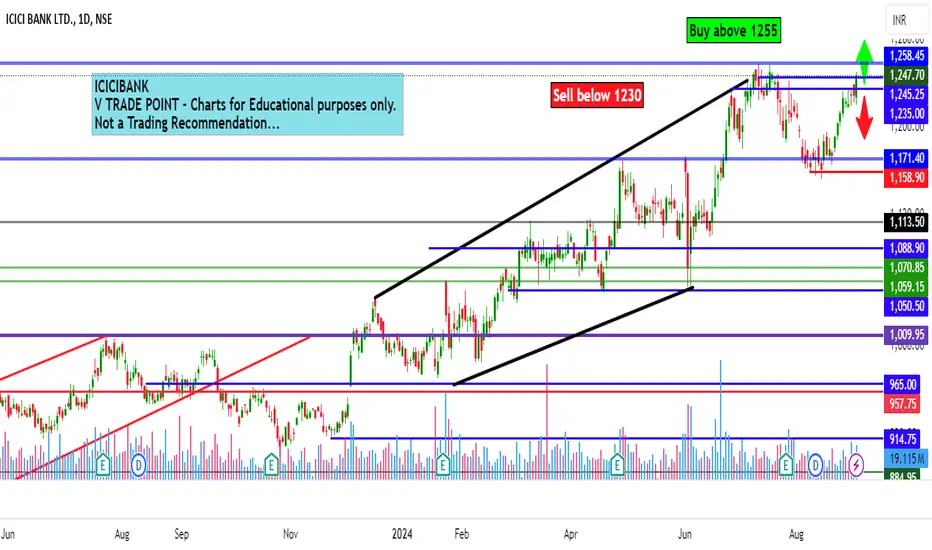
ICICI Bank Ltd view for Intraday 4th September #ICICIBANK ICICI Bank Ltd view for Intraday 4th September #ICICIBANK
Buying may witness above 1255
Support area 1230. Below ignoring buying momentum for intraday
Selling may witness below 1230
Resistance area 1255
Above ignoring selling momentum for intraday
Charts for Educational purposes only.
Please follow strict stop loss and risk reward if you follow the level.
Thanks,
V Trade Point
ICICI BANK ELLIOT WAVE ANALYSIS #icicibank #elliotwave Icici bank one hour chart elliot wave analysis . this stock complete 1,2,3 or 4 . wave 5 start
