ICICIBANK trade ideas


ICICIBANK - Ascending Triangle (Intraday/Very Short Term)This analysis is purely based on price action and Chart Patterns.
The analysis is on 15min TF hence target can be achieved in intraday trade or in couple of days
Trade strategy is explained in image itself. Don't run after the price. If prices gives big breakout/breakdown, dont rush in trade.
Always plan your trade & trade your plan
Keep trailing SL accordingly once entered into the trade.
Trade at your own risk and money management
Feel free to comment for any queries & suggestion

ICICI Bank H&S Top and TargetsIcici Bank is forming a H&S pattern on hourly chart. Currently Printing Right Shoulder.
Pattern invalid if stock gives hourly close above 413 levels.
For this pattern to work, Stock must break below 390 and close there on hourly basis.
Target of this H&S Pattern are 365 and 350.


ICICI BANK looks bullish.ICICI bank making a bullish pattern(1D chart)
L.T.P.- 443.85
Target- 503
S.L.- 430

Icici intradayGood to buy at S2 tomorrow which happens to be support zone in channel for tgt upper channel

ICICI BANK positional set upICICI is bouncing from the 50% retracement levels....Possible fall in next few months...

ICICI BANK (DAILY) - CUP & HANDLE BREAKOUTICICI BANK ( DAILY)
CUP & HANDLE BREAKOUT
Cup formation as on 31st Aug 2020 till 21st Oct 2020 & Handle formation as on 21st Oct 2020 till 30th Oct 2020
Awaiting handle breakout at 402 levels for a target of 425 , provided stochastic turns from oversold position
RSI = 50
9 day EMA > 21 day EMA
Volume is Average
2nd buy above 430 levels for a target of 502 levels

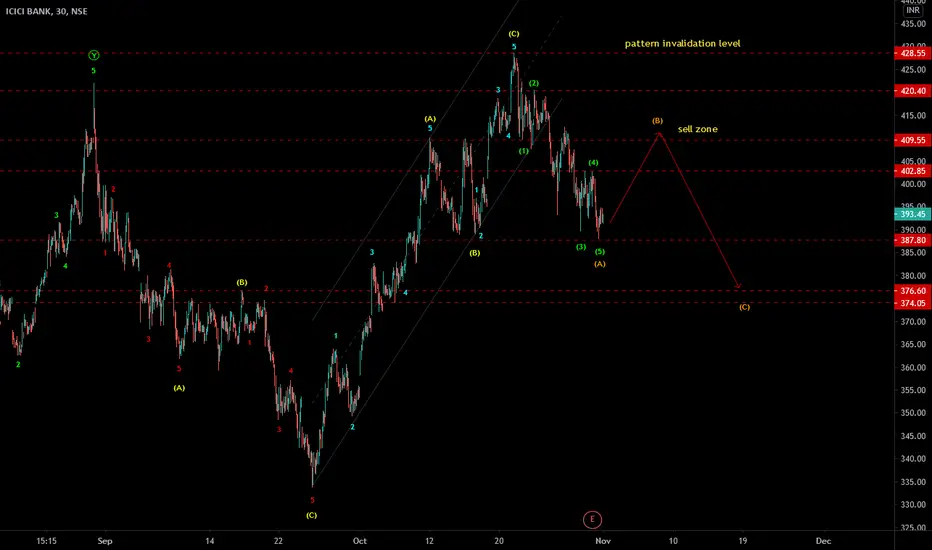
ICICIBANK - Elliott wave analysis - Sell on bounce ICICIBANK - The drop was impulse down as A wave. Expecting bounce of B wave as sell opportunity for C wave down. Wait for B to finish up to zone 405-415 with stop loss level above 428.60.
Give thumbs up if you really like the trade idea.
ICICIBANK 15MNCONFLUENCE OF 4HR & 1HR & 15MN Bullish BATS Strong POTENTIAL REVERSAL ZONE .For SCALPING
Now with confirmation from a BULLISH CANDLE with RSI above 30
POTENTIAL BUY

ICICIBANK 1HRCONFLUENCE OF 4HR & 1HRBullish BATS Strong POTENTIAL REVERSAL ZONE ...Ultra high volume down bar - trap of Smart Money , Higher volume-Professionals are buying into the public selling Price on breaking of ULTRA HIGH VOLUME Candle HIGH with NO SUPPLY i.e place for BUY
With Low Volumes & RSI MUST BE ABOVE 30 Then BECOMES VALID SET UP

ICICIBANK 4HRBullish BAT ...Ultra high volume down bar - trap of Smart Money , Higher volume-Professionals are buying into the public selling
Price on breaking of ULTRA HIGH VOLUME Candle HIGH with NO SUPPLY i.e place for BUY

ICICI Bank at SupportICICI looks good as long as above short term support of 402. Chances very high of going till 435 till 02nd Nov. Buy only if sustains above 402 for 1 hour tomorrow(28-10-2020).

ICICI Bank-Time to shortPrice coming up against trendline. So A short position could be initiated in this counter.
SL @ 432 Target 372

ICICIBANK - Elliott wave analysis - sell set upICICIBANK - It has completed zigzag in 30 min time frame since last swing low. It seems correct down now from major top in ABC, where B wave looks possibly a triangle. Sell with stop loss above 428.60 for target below 400 or lower. If it turn out as B wave triangle then price will go down directly below 413.50 and the fall will expected to sharp down. Let's see how the chart moves next.
Give thumbs up if you really like the trade idea.


Buy ICICI BankTargets 416/420
Main Stop Loss at 397
*Disclaimer : I just shared my view. Please trade with your comfortable and own ideas.
