ICICIBANK trade ideas

ICICI Bank - Go Short for swing tradeICICI Bank in channel and can go for short or buy 350 PE at 4RS
Note: This is for educational purpose only.


ICICI BANK : 03 SEP 20 :PROFITABLE PATTERN.
SEE ALL MY PUBLICATIONS, IT TAKES AT LEAST 30 TO ANALISE FROM DIFFERENT ANGLES, IF THE ANALYSIS SEEMS TO GIVE BOTH KNOWLEDGE AND PROFIT, THEN ONLY LIKE SUBSCRIBE AND SHARE TO YOUR FRIENDS.

bullish on icicistock touched its R2 resistance today and then reversed... if someone woulld have traded the 15 min heiken Ashi candle for consecutive bar strategy, he woukd have made good profits.
none the less...this counter is still a long candidate watch out for a stoploss of 379 and trade...
my suggestion ---
1. no FnO trade
2. buy 50 percent quantity at this rate , and 50 percent nest 380 levels... stopless 375/378 based on your selection
3. i expect a flag pattern formatiion at this level to eat premium


ICICIBank : BullishICICIBank looks bullish and heading towards to cross 200 SMA. Considering the technical indicators, expecting target to 440 with SL 393.It is just my analysis and opinion.


Icici - breaking outICICI bank.
Broke out of box.
Buy above high on Monday.
Possible 10% to 455 -460 levels.
If able to hold that level and then a close open above 460 will take it to 500 levels.
RSI and Stochastic are as per rules.
ATR is also low.
340 was help couple of times.
Yester broke out with good volume


ICICI BANK_LONGhello folks!
ICICI bank looks good for long.
multiple entry reasons
SL & target mentioned in charts
All the best!


ICICI : 31 AUG 20 :WHAT MIGHT NEXT? ONLY PROFIT.
A BEAUTIFUL SMILE IN PROFIT AND A LIKE TO PROFIT MAKING IDEAS ARE SAME, SEE ALL MY IDEAS, IF IT SEEMS TO BE PROFIT THEN ONLY LIKE THIS.

Bearish Crab - ICICIBANK - Daily TF.Hello,
Pattern : Bearish Crab
Stock : NSE:ICICIBANK
Time Frame : Daily TF.
Note : This chart is only for study and reference purpose.


ICICI BANK ABOUT TO FIRE-HIGH VOLUMES, HIGH DELIVERIES, STRONG SUPPORT @ 340 & @320
DOWNSIDE IS MINIMUM AND UPSIDE IS OPEN.
BUY IF SUSTAIN ABOVE : 360
TARGET 1 : 400
TARGET 2 : 440
STOP LOSS : 320
**These are my personal observations. Please trade at your own risk.**

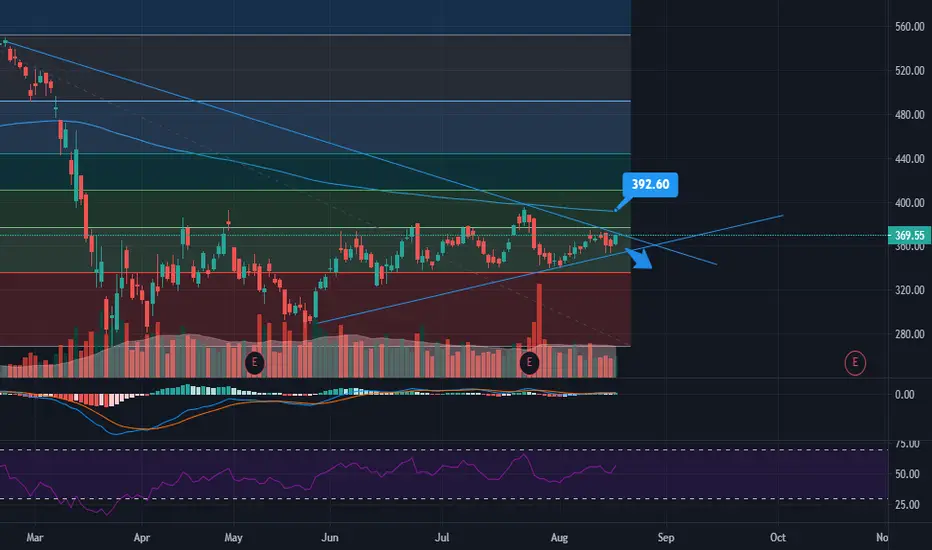
ICICI Bank Can it Break the Barriers ???ICICI bank adhering the trend line
Will it break the resistance area
Too many obstacles for target around 390 level if traded above 372
Stop loss on closing basis 350 355 levels